| Table 1. Calibration data. Mean, standard deviation (SD) and maximum values of some plot characteristics, at the first measurement, by stand type. | |||||||||||||||
| Stand type | Site index*, m | Density, stems ha–1 | Age, years | Mean height**, m | |||||||||||
| Mean | SD | Max | Mean | SD | Max | Mean | SD | Max | Mean | SD | Max | ||||
| Scots pine (N = 899) | 20.2 | 4.0 | 32 | 2679 | 1063 | 6000 | 21.8 | 4.4 | 38 | 3.6 | 2.0 | 13.4 | |||
| Norway spruce (N = 498) | 24.7 | 5.3 | 36 | 2645 | 1026 | 5800 | 21.2 | 3.7 | 38 | 4.3 | 2.2 | 15.4 | |||
| * Site index according to site properties (Hägglund and Lundmark 1977) ** Height weighted mean height | |||||||||||||||
| Table 2. Calibration data. Mean, standard deviation (SD) and maximum values of some tree characteristics, at the first measurement, by tree species. | |||||||||||
| Tree species | Tree height (h), m | ih5* | hci** | ||||||||
| Mean | SD | Max | Mean | SD | Max | Mean | SD | Max | |||
| Scots pine (N = 10201) | 3.9 | 2.4 | 15.6 | 1.8 | 0.8 | 6.3 | 26.2 | 30.5 | 345 | ||
| Norway spruce (N = 8163) | 4.0 | 2.7 | 19.2 | 1.9 | 1.1 | 6.0 | 38.7 | 41.1 | 349 | ||
| * ih5 = Height increment for the 5-year period ** hci = Distance-independent competition index (Table 6) | |||||||||||
| Table 3. Validation data. Mean, standard deviation (SD) and maximum values of some plot characteristics, at the first measurement, by tree species. | |||||||||||||||
| Site index*, m | Density, stems ha–1 | Age, years | Mean height**, m | ||||||||||||
| Mean | SD | Max | Mean | SD | Max | Mean | SD | Max | Mean | SD | Max | ||||
| Scots pine (N = 224) | 24.5 | 3.4 | 31.2 | 2770 | 1790 | 18430 | 26 | 9 | 50 | 6.5 | 2.7 | 14.3 | |||
| Norway spruce (N = 83) | 32.2 | 4.8 | 38.4 | 2540 | 1480 | 8370 | 23.5 | 6 | 38 | 7.1 | 2.4 | 12.3 | |||
| * Site index according to site properties (Hägglund and Lundmark 1977) ** Height-weighted mean heigh | |||||||||||||||
| Table 4. Key features of the trials from which the data for genetically improved trees were obtained. View in new window/tab. |
| Table 5. Parameter estimates for height growth models for individual trees in young stands of Scots pine and Norway spruce in Sweden. Dependent variable ih5, m. For variable explanation, see Table 6. | ||||
| Pine, n = 10201 | Spruce, n = 8163 | |||
| Variable | Parameter | SEE b | Parameter | SEE b |
| constant | –1.6474 | 0.05294 | –3.3560 | 0.08291 |
| h | –0.1213 | 0.004164 | –0.1431 | 0.004974 |
| ln(h) | 0.5728 | 0.01549 | 0.6222 | 0.04098 |
| hci/(0.1 + h) | –0.01329 | 0.000583 | –0.02013 | 0.000783 |
| ln(h × Hh) | - | - | 0.1384 | 0.02559 |
| Hh/T | 0.7810 | 0.07038 | 0.2905 | 0.08202 |
| ln(SI) | 0.6522 | 0.01846 | 1.0804 | 0.02678 |
| Newcl | - | - | 0.03032 | 0.006996 |
| Spcult | - | - | 0.09691 | 0.008062 |
| estimated variance components | ||||
| 0.07545 | 0.08246 | |||
| 0.2254 | 0.3325 | |||
| b standard error of estimate | ||||
| Table 6. Symbols for variables used in height increment models. | |
| Variable | Definition and units |
| ih5 | Single tree 5-year height increment, m |
| h | Initial tree height, m |
| Hh | Height-weighted mean height, Σh2/Σh, of all trees on the plot, m |
| T | Stand age, expressed as basal area-weighted total age in the plot, years |
| hci | Distance-independent competition index, sum of the height square (Σh2) ×0.1 of all trees taller than the subject tree in the plot (100 m2). |
| Newcl | Indicator variable for pre-commercially thinned plots. Newcl = 1 if the plot was cleaned within 10 years before the measurement, otherwise Newcl = 0 |
| Spcult | Indicator variable for spruce establishment by planting. Spcult = 1 if the plot was planted with spruce, otherwise Spcult = 0 |
| SI | Site index (m), according to site properties (Hägglund and Lundmark 1977) |

Fig. 1. Mean prediction error of height increment (m) over estimated height increment (m) for the calibration and the validation data set. The numbers in the graph represent the number of trees in each height class.
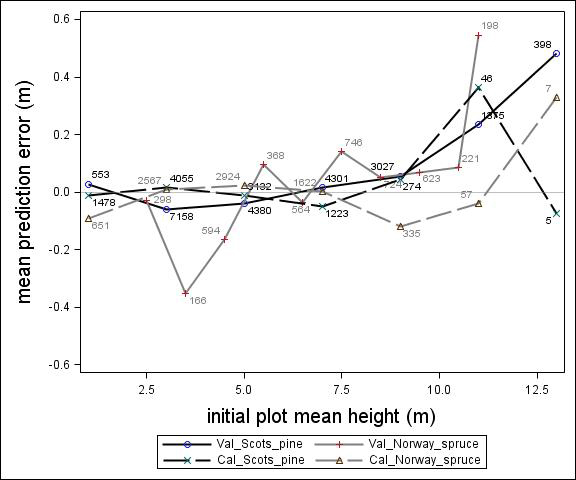
Fig. 2. Mean prediction error of height increment (m) over initial plot mean height (m) for calibration and the validation data set. The numbers in the graph represent the number of trees in each height class.
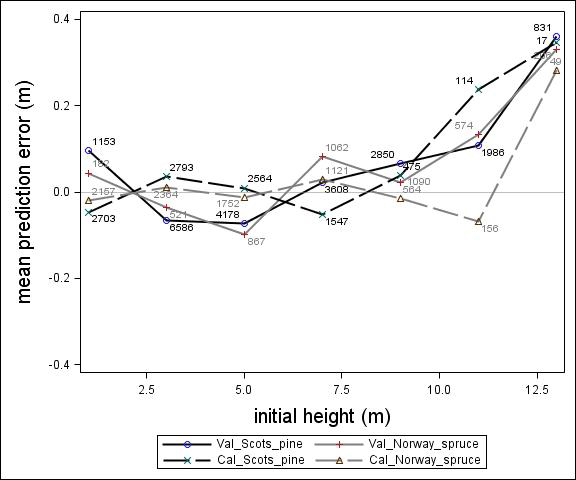
Fig. 3. Mean prediction error of height increment (m) over initial height (m) for the calibration and the validation data set. The numbers in the graph represent the number of trees in each height class.
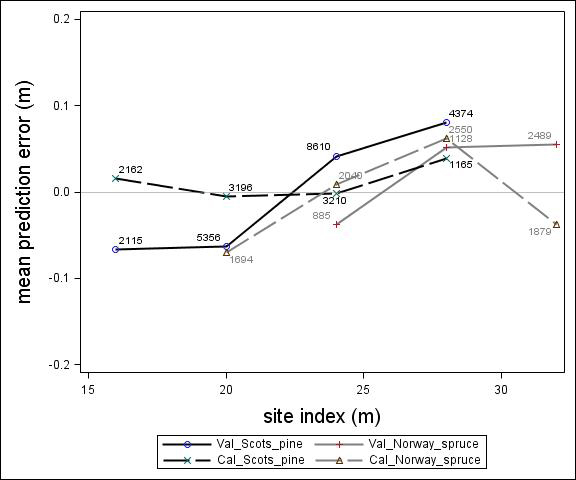
Fig. 4. Mean prediction error of height increment (m) over site index (m) for the calibration and the validation data set. The numbers in the graph represent the number of trees in each height class.
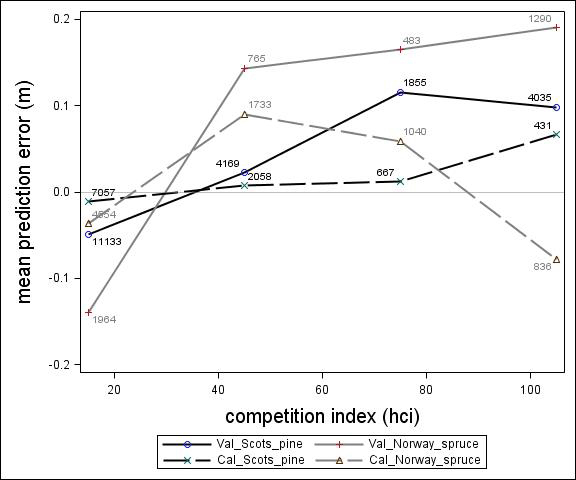
Fig. 5. Mean prediction error of height increment (m) over competition index for the calibration and the validation data set. The numbers in the graph represent the number of trees in each competition index class.
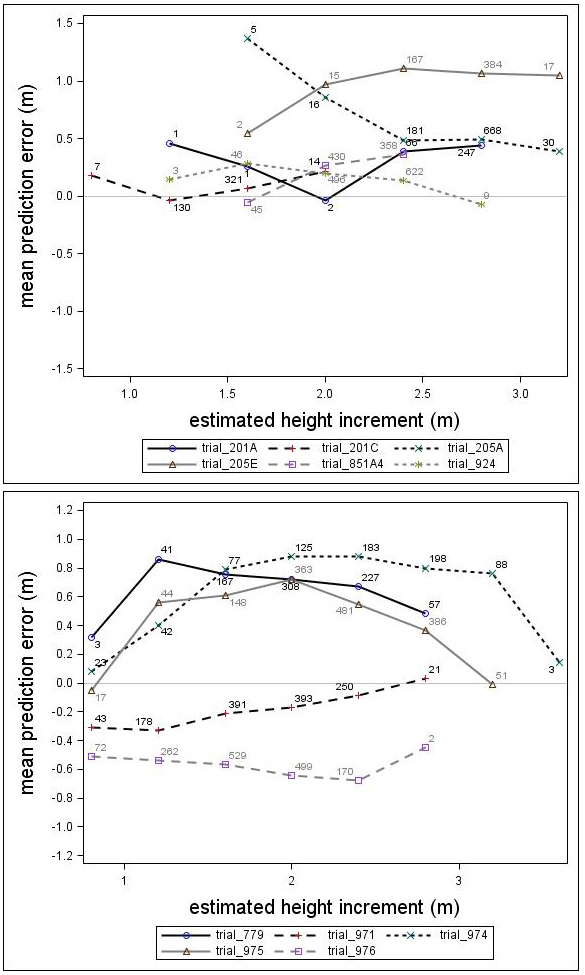
Fig. 6. Mean prediction error of height increment (m) over estimated height increment (m) for the Scots pine (upper) and Norway spruce (lower) genetic field trials. The numbers in the graph represent the number of trees in each height increment class.
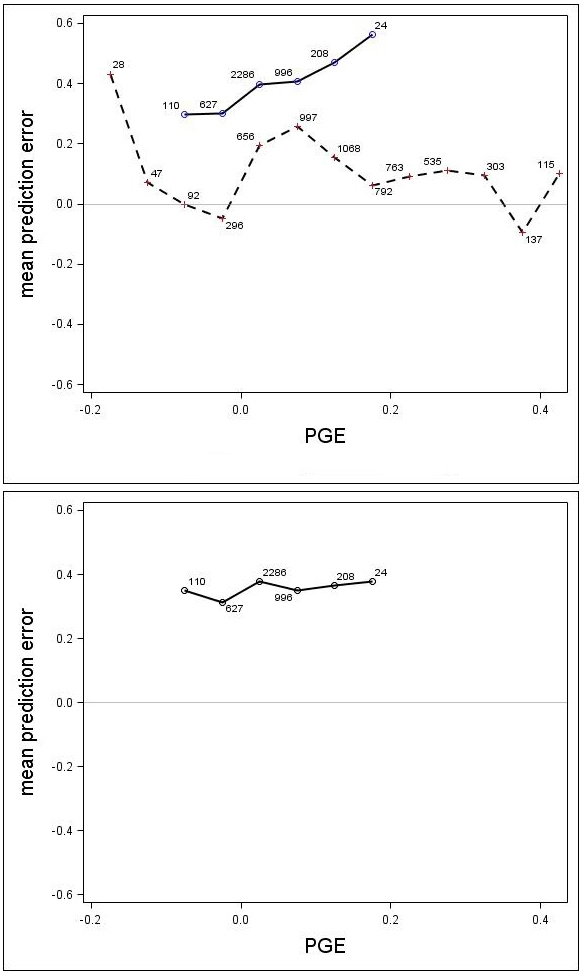
Fig. 7. Mean prediction error (m) for the unadjusted (upper) and adjusted (lower) growth models for Scots pine (solid line) and Norway spruce (dashed line) plotted against PGE. The numbers in the graph represent the number of trees in each PGE-class. Note that the Norway spruce model was not adjusted, so this species does not appear in the lower graph.