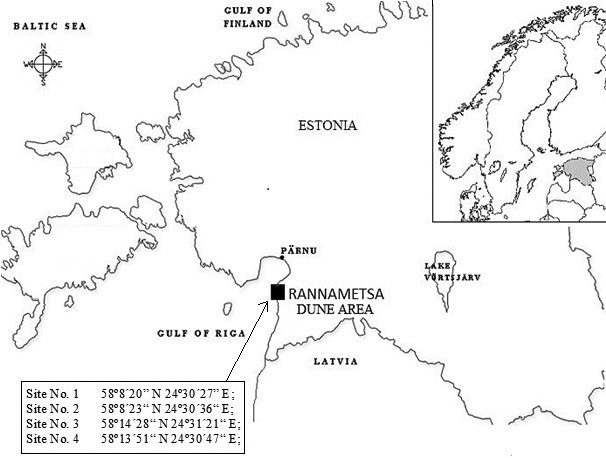
Fig. 1. Location of study area and study sites.
| Table 1. Average characteristics of the investigated stands. | ||||||||||
| Site No. | Soil type | Forest site type | Composition of trees | No. of trees per hectare | Age, yr | Site quality index | Canopy cover | Height, m | Breast height diameter, cm | Density of understory |
| 1 | Haplic Podzol | Rhodococcum | 100 Ps | 149 | 180 | IV | 0.45 | 24 | 37 | Low |
| 2 | Haplic Podzol | Cladonia | 100 Ps | 191 | 190 | IV | 0.54 | 24 | 36 | Low |
| 3 | Haplic Podzol | Cladonia | 100 Ps | 98 | 200 | IV | 0.62 | 21 | 44 | Low |
| 4 | Haplic Podzol | Cladonia | 100 Ps | 143 | 210 | IV | 0.60 | 23 | 38 | Low |
| Ps = Pinus sylvestris | ||||||||||
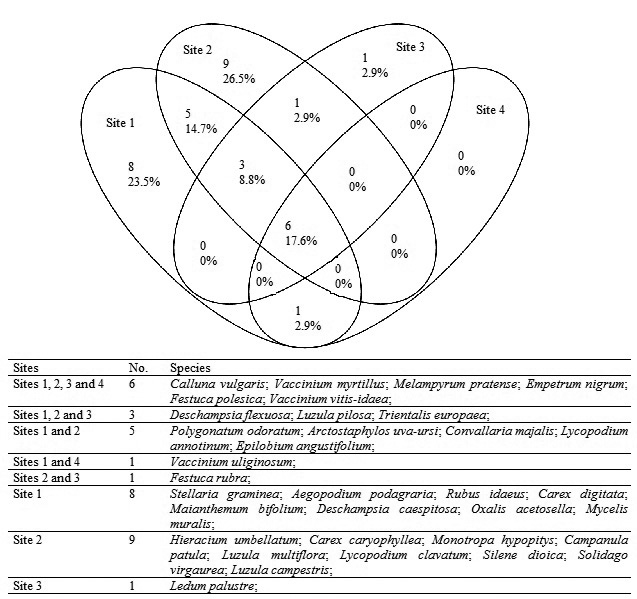
Fig. 2. Venn diagram showing the overlapping and individuality of vascular plant species at different sites.
| Table 2. The results of multiple response permutation procedure (MRPP) tests for the comparison of species composition on different dunes. | ||||||
| Test pair | Site 1 vs. Site 2 | Site 1 vs. Site 3 | Site 1 vs. Site 4 | Site 2 vs. Site 3 | Site 2 vs. Site 4 | Site 3 vs. Site 4 |
| p-value | <0.001 | <0.001 | <0.001 | 0.002 | <0.001 | 0.011 |
| Bold values are significant after the Bonferroni correction | ||||||
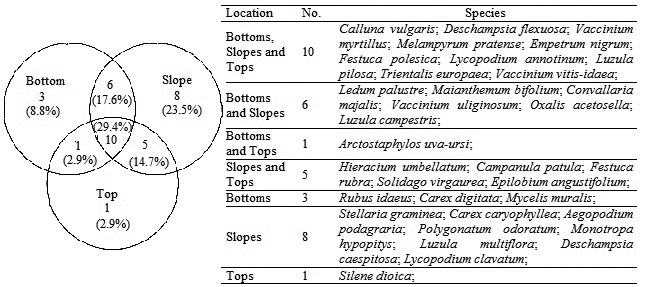
Fig. 3. Venn diagram showing the overlapping and individuality of vascular plant species at different locations on dunes.
| Table 3. Vascular plant indicator species with indicator values (IV) for different zones (bottom, slope and top) on dunes according to the indicator species analysis (ISA). | |||||||||||
| Bottom | Slope | Top | |||||||||
| IV | p-value | IV | p-value | IV | p-value | ||||||
| Site 1 | Rubu ida | 28 | 0.011 | Empe nig | 36 | 0.016 | Call vul | 32 | 0.05 | ||
| Oxal ace | 25 | 0.041 | |||||||||
| Mela pra | 50 | 0.042 | |||||||||
| Site 2 | Empe nig | 53 | 0.0002 | Hier umb | 26 | 0.001 | |||||
| Fest pol | 50 | 0.0004 | Call vul | 50 | 0.001 | ||||||
| Conv maj | 13 | 0.035 | Mela pra | 52 | 0.002 | ||||||
| Soli vir | 26 | 0.002 | |||||||||
| Fest rub | 35 | 0.006 | |||||||||
| Trie eur | 21 | 0.021 | |||||||||
| Site 3 | Vacc myr | 73 | 0.0002 | Trie eur | 61 | 0.001 | Fest rub | 41 | 0.05 | ||
| Vacc vit | 69 | 0.0002 | |||||||||
| Ledu pal | 43 | 0.012 | |||||||||
| Site 4 | Vacc uli | 38 | 0.012 | Fest pol | 48 | 0.025 | Empe nig | 52 | 0.002 | ||
| Call vul | 59 | 0.008 | |||||||||
| Rubu ida = Rubus idaeus; Oxal ace = Oxalis acetosella; Mela pra = Melampyrum pratense; Empe nig = Empetrum nigrum; Fest pol = Festuca polesica; Conv maj = Convallaria majalis; Vacc myr = Vaccinium myrtillus; Vacc vit = Vaccinium vitis-idaea; Ledu pal = Ledum palustre; Vacc uli = Vaccinium uliginosum; Trie eur = Trientalis europaea; Call vul = Calluna vulgaris; Hier umb = Hieracium umbellatum; Soli vir = Solidago virgaurea; Fest rub = Festuca rubra | |||||||||||
| Table 4. Average values of soil and light characteristics from different sites and locations on the dunes. View in new window/tab. |
| Table 5. Significance (p-values, type 3 effects) of factors contributing to species richness and the coverage of vascular plants according to a linear mixed model. | |||
| Species richness of vascular plants | DF | F-value | p-value |
| Location on dune (zone) | 215.97 | 15.43 | <0.001 |
| Aspect of the quadrat | 7.87 | 16.67 | <0.001 |
| Absolute height | 183.53 | 0.17 | 0.685a |
| Cover of bryophyte and lichen layers | 215.42 | 0.003 | 0.960a |
| PAR | 215.18 | 15.46 | <0.001a |
| VWC | 216.36 | 26.54 | <0.001 |
| pH | 216.54 | 10.70 | 0.001 |
| Ntotal | 215.46 | 29.22 | <0.001a |
| P | 216.92 | 0.002 | 0.969 |
| K | 216.85 | 4.98 | 0.027 |
| O horizon | 215.50 | 1.97 | 0.162 |
| Total cover of vascular plant species | DF | F-value | p-value |
| Location on dune | 102.68 | 13.46 | <0.001 |
| Aspect of the quadrat | 3.29 | 1.53 | 0.356 |
| Absolute height | 2.31 | 22.06 | 0.032 |
| Cover of bryophyte and lichen layers | 199.17 | 1.86 | 0.174a |
| PAR | 216.78 | 0.04 | 0.844 |
| VWC | 205.64 | 22.96 | <0.001 |
| pH | 124.85 | 4.78 | 0.031a |
| Ntotal | 217.00 | 27.28 | <0.001a |
| P | 32.27 | 0.12 | 0.727 |
| K | 139.17 | 24.43 | <0.001 |
| O horizon | 174.46 | 6.61 | 0.011 |
| a – indicates a negative effect | |||
| PAR = below-canopy photosynthetically active radiation (μmol m–2 s–1); VWC = average soil volumetric water content (%); pH = average pHH2O; O = soil litter horizon thickness (cm); Ntotal = nitrogen content (%); P = phosphorus content (mg kg–1); K = potassium content (mg kg–1) | |||
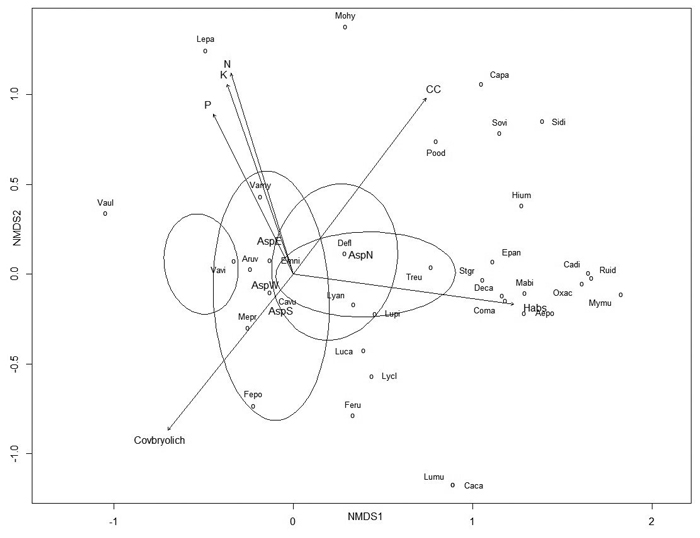
Fig. 4. Non-metric multidimensional scaling (NMDS) ordination graph with fitted environmental variables. Arrows represent environmental variables that were most significantly (p ≤ 0.005) related to ordination. View larger in new window/tab.
| Table 6. Relationships between species composition (non-metric multidimensional scaling (NMDS) ordination, Fig. 4) and environmental variables on dunes. Bold values are variables presented as arrows in Fig. 4. | |||
| Variable | r2 | p-value | Level of significance |
| Habs | 0.2541 | 0.001 | *** |
| CC | 0.2486 | 0.001 | *** |
| Covbryolich | 0.2054 | 0.001 | *** |
| Site | 0.2949 | 0.001 | *** |
| Ntotal | 0.2259 | 0.002 | ** |
| Asp | 0.1552 | 0.003 | ** |
| K | 0.2067 | 0.004 | ** |
| P | 0.1634 | 0.005 | ** |
| Mg | 0.1826 | 0.007 | ** |
| VWCaver | 0.1553 | 0.008 | ** |
| pH | 0.1248 | 0.022 | * |
| Ca | 0.1180 | 0.030 | * |
| Hrel | 0.0942 | 0.062 | . |
| EC | 0.0809 | 0.073 | . |
| Degr | 0.0622 | 0.158 | |
| Loc | 0.0497 | 0.225 | |
| O | 0.0150 | 0.655 | |
| A | 0.0103 | 0.744 | |
| PAR | 0.0026 | 0.914 | |
| Significance codes: 0 ‘***’ 0.001 ‘**’ 0.01 ‘*’ 0.05 ‘.’ 0.1 ‘ ’ 1 | |||
| Habs = absolute height of the quadrat location (m); CC = average canopy cover; Covbryolich = total coverage of bryophytes and lichens (%); Ntotal = average total nitrogen content (%); Asp = aspect of the quadrat; K = average potassium content (mg kg–1); P = average phosphorus content (mg kg–1); Mg = average magnesium content (mg kg–1); VWCaver = average soil water content (%); pH = average soil pHH2O; Ca = average soil calcium content (mg kg–1); Hrel = relative height (m); EC = electrical conductivity (µS); Degr = degree of inclination or ascent; Loc = location on dune (bottom, slope, top); O = average litter horizon thickness (cm); A = average humus horizon thickness (cm); PAR = average photosynthetically active radiation (μmol m–2 s–1) | |||