| Table 1. Comparison of the mean values (±SE) of secondary root, primary root and the main stem weights (SRW, PRW and MSW, respectively) and main stem length (MSL), visual above-ground assessment (VA); and water potential (Ψ) in Quercus ilex and Quercus suber control seedlings (n = 45) 45 days after inoculation. | ||||||
| SRW (g) | PRW (g) | MSW (g) | MSL (cm) | VA (class) | Ψ (-MPa) | |
| Quercus ilex | 0.319 ± 0.025 | 1.547 ± 0.176 | 0.081 ± 0.062 | 10.55 ± 0.75 | 1.60 ± 0.21 | 0.76 ± 0.19 |
| Quercus suber | 0.434 ± 0.047 | 3.984 ± 0.467 | 2.041 ± 0.197 | 23.06 ± 2.017 | 2.00 ± 0.17 | 0.22 ± 0.03 |
| p-value | 0.04 | 0.006 | <0.001 | <0.001 | 0.001 | 0.013 |
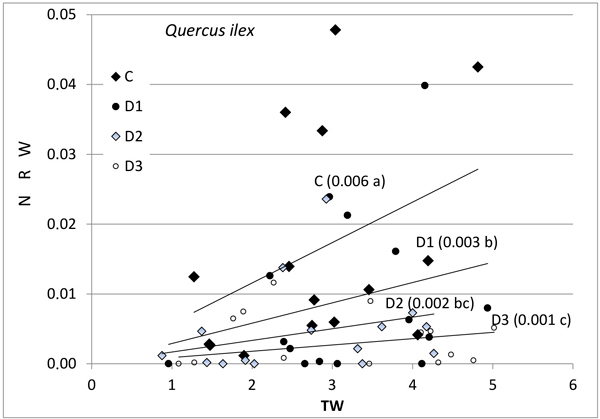
Fig. 1. Relationship between new root weight (g) (NRW) and total seedling weight (g) (TW) in Quercus ilex for the different Inoculum level used. Different letters by the regression lines indicate significantly different slopes. C (control): solid diamond; D1 (dose 1): solid circle; D2 (dose 2): hollow diamond; and D3 (dose 3): hollow circle.
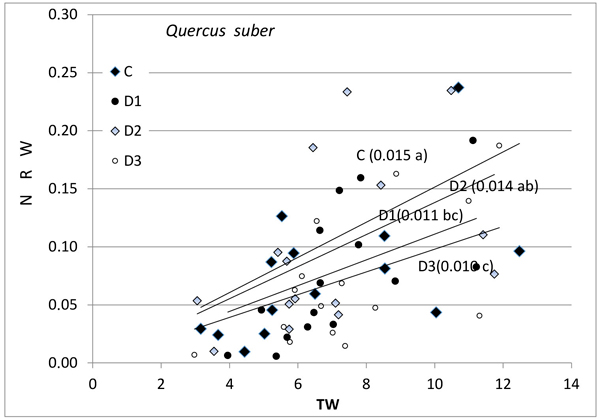
Fig. 2. Relationship between new root weight (g) (NRW) and total seedling weight (g) (TW) in Quercus suber for the different Inoculum level used. Different letters by the regression lines indicate significantly different slopes. C (Control): solid diamond; D1 (dose 1): solid circle; D2 (dose 2): hollow diamond; and D3 (dose 3): hollow circle.
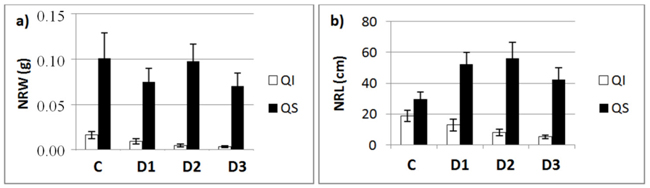
Fig. 3. a) New root weight (NRW; mean ± SD) and b) new root length (NRL; mean± SD) for each of study Inoculum level (C, control; D1, dose 1; D2, dose 2 and D3, dose 3) in seedlings of Quercus ilex (Qi) and Quercus suber (Qs) (n = 45).
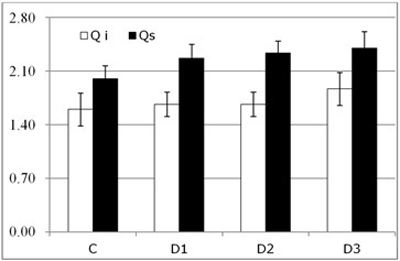
Fig. 4. Results of visual above-ground assessment (symptom score, mean ± SD) for each of the study Inoculum level (C, control; D1, dose 1; D2, dose 2 and D3, dose 3) in seedlings of Quercus ilex (Qi) and Quercus suber (Qs) (n = 120).
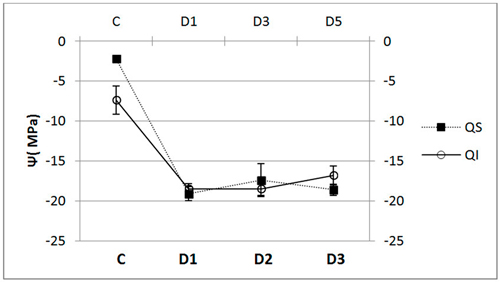
Fig. 5. Water potential (Ψ, mean ± SD) for each of the study Inoculum (C, control; D1, dose 1; D2, dose 2 and D3, dose 3) in seedlings of Quercus ilex (Qi) (n = 60) and Quercus suber (Qs) (n = 60).