| Table 1. Sawlog and veneer log production in the selected countries. | |||||
| Country | Coniferous (in ´000 m3) | Non-Coniferous (in ´000 m3) | Total (in ´000 m3) | Percent coniferous world production | Percent non-coniferous world production |
| Brazil | 30 000 | 32 950 | 62 950 | 4.8% | 11.9% |
| Canada | 115 500 | 6598 | 122 098 | 18.4% | 2.4% |
| Chile | 15 523 | 624 | 16 147 | 2.5% | 0.2% |
| Finland | 18 526 | 796 | 19 322 | 3.0% | 0.3% |
| Germany | 23 457 | 3175 | 26 632 | 3.7% | 1.1% |
| Norway | 4458 | 2 | 4460 | 0.7% | 0.0% |
| Poland | 11 748 | 2827 | 14 575 | 1.9% | 1.0% |
| Russia | 67 200 | 17 300 | 84 500 | 10.7% | 6.2% |
| Sweden | 32 100 | 200 | 32 300 | 5.1% | 0.1% |
| US | 133 742 | 33 369 | 167 111 | 21.4% | 12.0% |
| Total world | 626 121 | 277 838 | 903 959 | 32.4% | 20.8% |
| Source: FAO 2013b | |||||
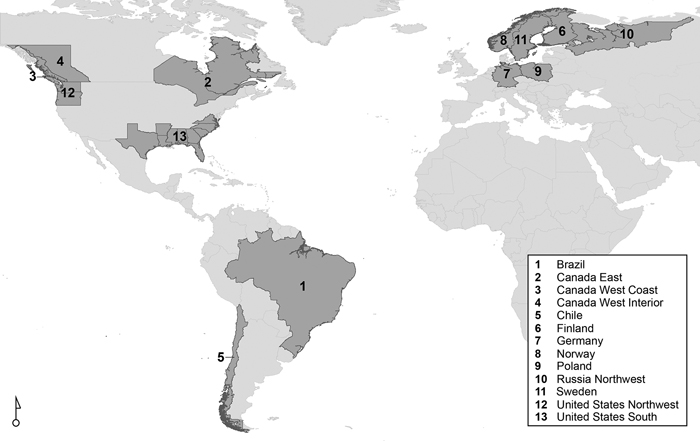
Fig. 1. Selected regions.
| Table 2. Coniferous sawlog nominal delivered prices, in USD per m3. | ||||||
| Sawlog market | Number of observations | Mean | Standard deviation | Coefficient of variation | Min. | Max. |
| Norway | 71 | 76.24 | 16.5 | 22% | 51 | 117 |
| Sweden | 71 | 75.28 | 15.43 | 20% | 51 | 110 |
| Finland | 71 | 86.07 | 19.11 | 22% | 58 | 130 |
| Brazil | 71 | 42.12 | 20.49 | 49% | 16 | 78 |
| Chile | 71 | 39.19 | 5.17 | 13% | 31 | 48 |
| Germany | 71 | 110.14 | 27.05 | 25% | 67 | 166 |
| Poland | 59 | 62.56 | 18.25 | 29% | 41 | 107 |
| Russia Northwest | 46 | 45.73 | 17.2 | 38% | 23 | 80 |
| US South | 43 | 66.19 | 3.8 | 6% | 60 | 72 |
| US Northwest | 43 | 91.42 | 16.59 | 18% | 53 | 119 |
| Canada East | 43 | 65.33 | 8.59 | 13% | 46 | 77 |
| Canada West (Coast)(1) | 43 | 50.05 | 6.03 | 12% | 39 | 65 |
| Canada West (Coast)(2) | 35 | 76.51 | 10.57 | 14% | 57 | 97 |
| Canada West (Interior) | 43 | 43.02 | 5.53 | 13% | 32 | 53 |
| (1) Hemlock; (2) Douglas-fir | ||||||
| Table 3. Coniferous sawlog nominal delivered prices, in EUR per m3. | ||||||
| Sawlog market | Number of observations | Mean | Standard deviation | Coefficient of variation | Min. | Max. |
| Norway | 71 | 62.6 | 6.2 | 10% | 53.3 | 80.7 |
| Sweden | 71 | 62.0 | 6.2 | 10% | 47.6 | 81.1 |
| Finland | 71 | 70.7 | 7.4 | 10% | 60.9 | 94.2 |
| Germany | 71 | 90.3 | 12.8 | 14% | 72.2 | 118.7 |
| Brazil | 71 | 33.6 | 13 | 39% | 15.6 | 54.9 |
| Chile | 71 | 32.6 | 2.9 | 9% | 26.4 | 38.6 |
| Poland | 59 | 51.3 | 8.7 | 17% | 37.1 | 69.4 |
| Russia Northwest | 47 | 35.6 | 9.8 | 28% | 22 | 54.9 |
| Table 4. Unit roots for sawlog prices in nominal USD, 1995–2012. | ||||||||
| Sawlog market | SBIC | Levels | First differences | |||||
| ADF | PP | ADF-GLS | ADF | PP | ADF-GLS | |||
| Norway | 2 | –1.75 | –1.52 | –1.57 | –4.62* | –5.52* | –4.04* | |
| Sweden | 2 | –1.57 | –1.57 | –1.74 | –4.62* | –5.67* | –5.10* | |
| Finland | 2 | –1.29 | –1.31 | –1.29 | –4.52* | –6.86* | –2.94* | |
| Brazil | 2 | –0.61 | –0.61 | –0.64 | –4.83* | –6.11* | –4.47* | |
| Chile | 1 | –0.81 | –0.68 | –0.72 | –5.04* | –7.03* | –5.07* | |
| Germany | 2 | –1.17 | –1.17 | –1.28 | –3.98* | –5.86* | –4.73* | |
| (1) SBIC = Schwartz Bayesian Criteria, ADF = Augmented Dickey-Fuller unit root test, PP = Phillips-Perron unit root test, ADF-GLS = Dickey-Fuller General Least Squares unit root test; (2) for the ADF-GLS tests in levels, one lag was used; (3) *significant at 1%, **significant at 5%, ***significant at 10% | ||||||||
| Table 5. Pairwise cointegration tests for prices in USD, 1995–2012. | |||||
| Sawlog market | Norway | Sweden | Finland | Brazil | Chile |
| Sweden | 20.88 (2) | - | |||
| Finland | 14.05 (2) | 9.75 (3) | - | ||
| Brazil | 14.64 (2) | 11.28 (2) | 11.89 (2) | - | |
| Chile | 22.31 (4) | 16.61 (2) | 16.61 (1) | 14.66 (2) | - |
| Germany | 16.39 (2) | 20.27 (2) | 12.24 (2) | 15.73 (2) | 15.67 (2) |
| (1) The number of lags is in parenthesis; (2) bold font indicates the series that are cointegrated | |||||
| Table 6. VECM estimates for sawlog prices in USD, 1995–2012. | |||
| Variable | β | α | χ2 |
| Germany | 1 | 0.137 | |
| Sweden | –1.300 | 0.275 | 0.711 |
| C | 0.921 | ||
| Germany | 1 | 0.546 | |
| Norway | –1.275 | 0.194 | 0.460 |
| C | 0.823 | ||
| Chile | 1 | –0.142 | na |
| Norway | –0.712 | 0.278 | |
| C | –0.596 | ||
| Sweden | 1 | –0.172 | na |
| Chile | –1.281 | 0.083* | |
| C | 0.389 | ||
| Sweden | 1 | –0.313 | 0.468 |
| Norway | –0.923 | - | 0.494 |
| C | –0.326 | ||
| Germany | 1 | –0.192 | 0.026 |
| Brazil | –0.461 | - | 0.874 |
| C | –3.010 | ||
| Germany | 1 | –0.164 | na |
| Chile | –1.687 | 0.088 | |
| C | –1.513 | ||
| Finland | 1 | 0.623 | |
| Chile | –1.551 | 0.136 | 0.202 |
| C | 1.264 | ||
| (1) *Significant at 1%, **significant at 5%, ***significant at 10%; (2) the p-value is in italics; (3) C = constant | |||
| Table 7. Unit roots for sawlog prices in nominal USD, 2002–2012. | ||||||
| Species | Sawlog market | SBIC | Levels | First differences | ||
| ADF | PP | ADF | PP | |||
| Pine | US South | 1 | –1.05 | –1.18 | –5.25* | –6.86* |
| Douglas-fir | US Northwest | 1 | –1.38 | –1.65 | –3.59** | –4.54* |
| Mixed coniferous | Canada East | 2 | –2.41 | –2.35 | –4.92* | –5.23* |
| Hemlock | Canada West (Coast) | 1 | –2.65 | –2.68** | –3.93* | –5.12* |
| Douglas-fir | Canada West (Coast) | 1 | –1.50 | –2.12 | –4.87* | –8.48* |
| Mixed coniferous | Canada West (Interior) | 1 | –1.34 | –1.55 | –3.61* | –7.63* |
| Pine | Germany | 2 | –1.95 | –2.15 | –4.20* | –4.70* |
| Pine | Finland | 2 | –1.99 | –2.50 | –6.60* | –4.63* |
| Pine | Sweden | 2 | –2.13 | –2.24 | –3.68** | –4.07* |
| Pine | Norway | 2 | –1.98 | –2.28 | –3.68* | –3.83* |
| Pine | Poland | 1 | –1.72 | –1.54 | –4.30* | –5.63* |
| Pine | Russia | 1 | –1.83 | –1.71 | –3.59** | –5.30* |
| (1) SBIC = Schwartz Bayesian Criteria, ADF = Augmented Dickey-Fuller unit root test, PP = Phillips-Perron unit root test; (2) significant at 1%, **significant at 5%, ***significant at 10%; (3) Canada West Coast (Douglas-fir) series since 2004 | ||||||
| Table 8. Cointegration tests for coniferous sawlog nominal prices in USD in North America including the SLA, 2004–2012. | ||||||
| Maximum rank | Trace statistic | Critical value | Maximum eigenvalue statistic | Critical value | ||
| 5% | 1% | 5% | 1% | |||
| US Northwest (Douglas-fir), Canada West Coast (hemlock and Douglas-fir), Canada West Interior (mixed coniferous) | ||||||
| 0 | 68.00 | 47.21 | 54.46 | 32.92 | 27.07 | 32.24 |
| 1 | 35.09* | 29.68 | 35.65 | 18.89 | 20.97 | 25.52 |
| 2 | 16.19 | 15.41 | 20.04 | 13.08 | 14.07 | 18.63 |
| 3 | 3.12** | 3.76 | 6.65 | 3.12 | 3.76 | 6.65 |
| US Northwest (Douglas-fir), Canada West Coast (hemlock and Douglas-fir), Canada West Interior (mix coniferous), US South (pine), Canada East (mixed coniferous) | ||||||
| 0 | 158.58 | 94.15 | 103.18 | 60.84 | 39.37 | 45.10 |
| 1 | 97.74 | 68.52 | 76.07 | 37.74 | 33.46 | 38.77 |
| 2 | 60.00 | 47.21 | 54.46 | 26.23 | 27.07 | 32.24 |
| 3 | 33.77* | 29.68 | 35.65 | 13.54 | 20.97 | 25.52 |
| (1) The number of lags is in parenthesis; (2) *significant at 1%, **significant at 5%, ***significant at 10% | ||||||
| Table 9. VECM estimates for North American sawlog prices in USD, 2004–2012. | ||
| Region | β | α |
| Vector 1 | ||
| US Northwest (Douglas-fir) | 1 | –0.699 |
| Canada West Coast (hemlock) | 0 | 0.043*** |
| Canada West Interior (mixed coniferous) | 0 | –0.070*** |
| Canada West Coast (Douglas-fir) | –1.469 | 0.033*** |
| C | 1.826 | |
| Vector 2 | ||
| US Northwest (Douglas-fir) | 0 | 0.045*** |
| Canada West Coast (hemlock) | 1 | –0.560 |
| Canada West Interior (mixed coniferous) | 0 | 0.040*** |
| Canada West Coast (Douglas-fir) | –0.947 | –0.157*** |
| C | 0.399 | |
| Vector 3 | ||
| US Northwest (Douglas-fir) | 0 | 0.501 |
| Canada West Coast (hemlock) | 0 | 0.227*** |
| Canada West Interior (mixed coniferous) | 1 | 0.100*** |
| Canada West Coast (Douglas-fir) | –1.718 | 0.517 |
| C | 3.820 | |
| (1) The number of lags used is in parenthesis; (2) *significant at 1%, **significant at 5%, ***significant at 10%; (3) the p-value is in italics, (4) C = constant | ||
| Table 10. Unit roots for sawlog prices in EUR, 1995–2012. | ||||||||
| Sawlog market | SBIC | Levels | First differences | |||||
| ADF | PP | ADF-GLS | ADF | PP | ADF-GLS | |||
| Norway | 2 | –3.43** | –2.39 | –2.64* | - | –5.19* | - | |
| Sweden | 2 | –2.54 | –2.35 | –2.65* | –4.70* | –5.93* | - | |
| Finland | 2 | –2.04 | –2.07 | –1.32 | –5.36* | –6.76* | –2.94* | |
| Germany | 2 | –1.64 | –1.48 | –1.56 | –4.20* | –5.81* | –5.08* | |
| (1) SBIC = Schwartz Bayesian Criteria, ADF = Augmented Dickey-Fuller unit root test, PP = Phillips-Perron unit root test, ADF-GLS = Dickey-Fuller General Least Squares unit root test; (2) for the ADF-GLS tests in levels, one lag was used; (3) *significant at 1%, **significant at 5%, ***significant at 10% | ||||||||
| Table 11. Unit roots for sawlog prices in EUR, 2001–2012. | ||||||||
| Sawlog market | SBIC | Levels | First differences | |||||
| ADF | PP | ADF-GLS | ADF | PP | ADF-GLS | |||
| Norway | 2 | –2.85 | –1.95 | –2.47 | –4.16* | –3.75* | –2.88* | |
| Sweden | 2 | –2.11 | –1.81 | –2.17 | –3.68* | –4.39* | –3.35* | |
| Finland | 2 | –2.12 | –1.80 | –1.90 | –4.15* | –5.05* | –3.48* | |
| Poland | 1 | –1.30 | –1.24 | –1.70 | –3.65* | –6.42* | –3.27* | |
| Germany | 1 | –1.11 | –0.97 | –0.97 | –4.14* | –5.36* | –3.98* | |
| Russia Northwest | 1 | –1.17 | –1.36 | –0.93 | –4.56* | –6.22* | –3.28* | |
| (1) SBIC = Schwartz Bayesian Criteria, ADF = Augmented Dickey-Fuller unit root test, PP = Phillips-Perron unit root test, ADF-GLS = Dickey-Fuller General Least Squares unit root test; (2) for the ADF-GLS tests in levels, one lag was used; (3) *significant at 1%, **significant at 5%, ***significant at 10% | ||||||||
| Table 12. Cointegration tests for sawlog prices in EUR, 2001–2012. | |||||
| Norway | Sweden | Finland | Germany | Russia Northwest | |
| Sweden | 16.68 (2) | - | |||
| Finland | 22.25 (2) | 15.74 (2) | - | ||
| Germany | 33.26 (3) | 14 -(2) | 16.28 (1) | - | |
| Russia Northwest | 19.25 (2) | 10.78 (2) | 11.50 (2) | 8.17 (2) | - |
| Poland | 22.71 (2) | 8.76 (2) | 16.58 (2) | 12.15 (2) | 22.72 (2) |
| (1) The number of lags is in parenthesis; (2) bold font indicates the series that are cointegrated | |||||
| Table 13. VECM estimates for sawlog prices in EUR, 2001–2012. | |||
| Variable | β | α | χ2 |
| Norway | 1 | 1.440 | |
| Finland | –1.190 | 0.328 | 0.229 |
| C | –0.064 | ||
| Germany | 1 | 1.904 | |
| Norway | –1.715 | 0.347 | 0.168 |
| C | 2.596 | ||
| Norway | 1 | 0.180 | 1.597 |
| Poland | –0.210 | 0.206 | |
| C | –3.330 | ||
| Russia Northwest | 1 | 0.163 | |
| Poland | –1.511 | 0.321 | 0.069 |
| C | 2.433 | ||
| Russia Northwest | 1 | 0.953 | |
| Norway | –3.074 | 0.118 | 0.329 |
| C | 9.195 | ||
| Germany | 1 | 0.072 | |
| Finland | –1.87 | 0.232 | 0.788 |
| C | 3.522 | ||
| Finland | 1 | 2.264 | |
| Poland | –0.370 | –0.349 | 0.132 |
| C | –2.835 | ||
| (1) *Significant at 1%, **significant at 5%, ***significant at 10%; (2) the p-value is in italics, (3) C = constant | |||