| Table 1. Experiment description. |
| Test # | 1 | 2 | 3 |
| Effect probed | Feedstock | Work station | Knife wear |
| Place name | Cuneo | Envie | Envie |
| Machine 1 | PTH 1200/820 | PTH 1200/820 | - |
| Machine 2 | - | PTH 800/820 | PTH 800/820 |
| Cab machine A | Truck | Truck | - |
| Cab Machine B | - | Separate | Separate |
| Feedstock A | Chestnut logs | Chestnut logs | Chestnut logs |
| Feedstock B | Poplar branches | - | - |
| Knife conditions A | New | New | New |
| Knife conditions B | - | - | Blunt |
| Repetitions factor A | 9 | 9 | 8 |
| Repetitions factor B | 13 | 8 | 8 |
| Table 2. Comparison between feedstock types (i.e. logs vs. branches). |
| Exposure parameters | Unit | Action value | Log (n = 9) | Branch (n = 13) | Analysis of variance (ANOVA) |
| Mean | SD | Mean | SD | df1 | df2 | F | p-value |
| Noise |
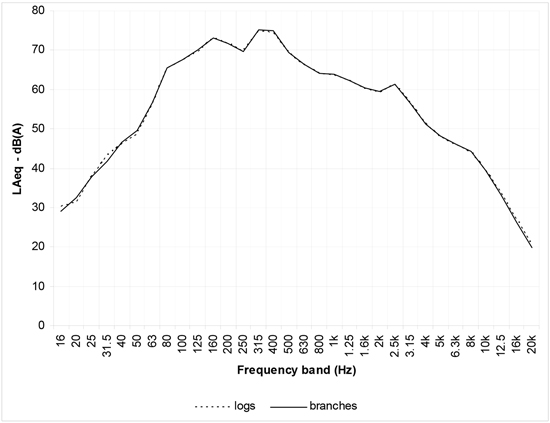
| LAeq | dB(A) | 80 | 81.51 | 0.12 | 81.70 | 0.15 | 1 | 20 | 10.986 | 0.003** |
| LpCpeak | dB(C) | 135 | 109.07 | 0.79 | 109.05 | 0.54 | 1 | 20 | 0.005 | 0.942 |
| Whole-body vibration |
| RMSX | m s–2 | 0.50 | 0.31 | 0.03 | 0.29 | 0.04 | 1 | 20 | 0.362 | 0.554 |
| RMSY | m s–2 | 0.50 | 0.18 | 0.01 | 0.18 | 0.02 | 1 | 20 | 0.13 | 0.722 |
| RMSZ | m s–2 | 0.50 | 0.19 | 0.01 | 0.18 | 0.01 | 1 | 20 | 8.795 | 0.008** |
| RMSVTV | m s–2 | 0.50 | 0.40 | 0.04 | 0.39 | 0.06 | 1 | 20 | 0.337 | 0.568 |
| VDVX | m s–1.75 | 9.1 | 6.22 | 0.66 | 6.13 | 1.20 | 1 | 20 | 0.018 | 0.896 |
| VDVY | m s–1.75 | 9.1 | 3.43 | 0.13 | 3.81 | 0.89 | 1 | 20 | 0.781 | 0.387 |
| VDVZ | m s–1.75 | 9.1 | 3.38 | 0.20 | 3.19 | 0.19 | 1 | 20 | 5.228 | 0.033* |
| VDVVTV | m s–1.75 | 9.1 | 7.99 | 0.83 | 8.04 | 1.94 | 1 | 20 | 0.006 | 0.941 |
Fig. 1. Noise frequency spectrum: logs vs. branches.
| Table 3. Comparison between work stations (i.e. truck cab vs. separate cab). |
| Exposure parameters | Unit | Action value | Truck cab (n = 9) | Separate cab (n = 8) | Analysis of variance (WELCH) |
| Mean | SD | Mean | SD | df1 | df2 | F | p-value |
| Noise |
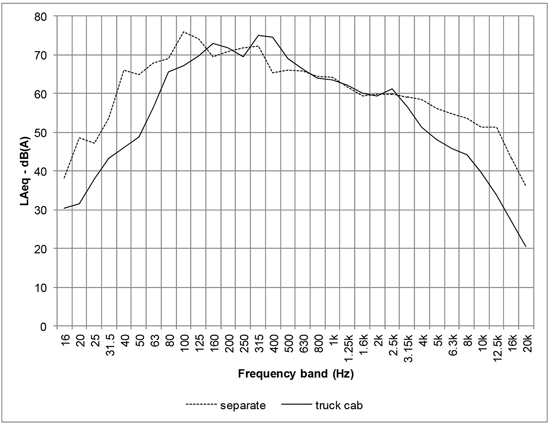
| LAeq | dB(A) | 80 | 81.51 | 0.12 | 81.94 | 0.73 | 1 | 7.309 | 2.700 | 0.143 |
| LpCpeak | dB(C) | 135 | 109.07 | 0.79 | 122.79 | 0.81 | 1 | 14.651 | 1250.086 | 0.000** |
| Whole-body vibration |
| RMSX | m s–2 | 0.50 | 0.31 | 0.03 | 0.59 | 0.07 | 1 | 9.199 | 68.289 | 0.000** |
| RMSY | m s–2 | 0.50 | 0.18 | 0.01 | 0.59 | 0.08 | 1 | 7.091 | 111.925 | 0.000** |
| RMSZ | m s–2 | 0.50 | 0.19 | 0.01 | 0.65 | 0.08 | 1 | 7.198 | 249.636 | 0.000** |
| RMSVTV | m s–2 | 0.50 | 0.40 | 0.04 | 1.06 | 0.13 | 1 | 7.879 | 181.013 | 0.000** |
| VDVX | m s–1.75 | 9.1 | 6.22 | 0.66 | 12.89 | 1.73 | 1 | 8.802 | 53.684 | 0.000** |
| VDVY | m s–1.75 | 9.1 | 3.43 | 0.13 | 13.76 | 2.15 | 1 | 7.045 | 94.122 | 0.000** |
| VDVZ | m s–1.75 | 9.1 | 3.38 | 0.20 | 15.85 | 2.30 | 1 | 7.095 | 233.411 | 0.000** |
| VDVVTV | m s–1.75 | 9.1 | 7.99 | 0.83 | 25.26 | 3.67 | 1 | 7.641 | 169.558 | 0.000** |
Fig. 2. Noise frequency spectrum: separate cab vs. truck cab.
| Table 4. Comparison between knife conditions (i.e. new vs. blunt). |
| Exposure parameters | Unit | Action value | New (n = 8) | Blunt (n = 8) | Analysis of variance (ANOVA) |
| Mean | SD | Mean | SD | df1 | df2 | F | p-value |
| Noise |
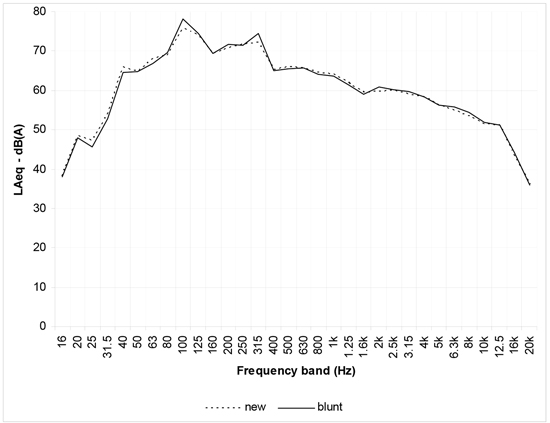
| LAeq | dB(A) | 80 | 81.94 | 0.73 | 83.00 | 0.42 | 1 | 14 | 17.168 | 0.001** |
| LpCpeak | dB(C) | 135 | 122.79 | 0.81 | 124.39 | 2.09 | 1 | 14 | 7.993 | 0.013* |
| Whole-body vibration |
| RMSX | m s–2 | 0.50 | 0.59 | 0.07 | 0.65 | 0.05 | 1 | 14 | 2.281 | 0.153 |
| RMSY | m s–2 | 0.50 | 0.59 | 0.08 | 0.62 | 0.07 | 1 | 14 | 0.413 | 0.531 |
| RMSZ | m s–2 | 0.50 | 0.65 | 0.08 | 0.68 | 0.08 | 1 | 14 | 1.937 | 0.186 |
| RMSVTV | m s–2 | 0.50 | 1.06 | 0.13 | 1.17 | 0.10 | 1 | 14 | 1.913 | 0.188 |
| VDVX | m s–1.75 | 9.1 | 12.89 | 1.73 | 14.28 | 1.74 | 1 | 14 | 1.704 | 0.213 |
| VDVY | m s–1.75 | 9.1 | 13.76 | 2.15 | 14.67 | 1.99 | 1 | 14 | 0.388 | 0.543 |
| VDVZ | m s–1.75 | 9.1 | 15.85 | 2.30 | 16.47 | 2.76 | 1 | 14 | 1.902 | 0.189 |
| VDVVTV | m s–1.75 | 9.1 | 25.26 | 3.67 | 28.57 | 3.19 | 1 | 14 | 2.551 | 0.133 |
Fig. 3. Noise frequency spectrum: new knives vs. blunt knives.