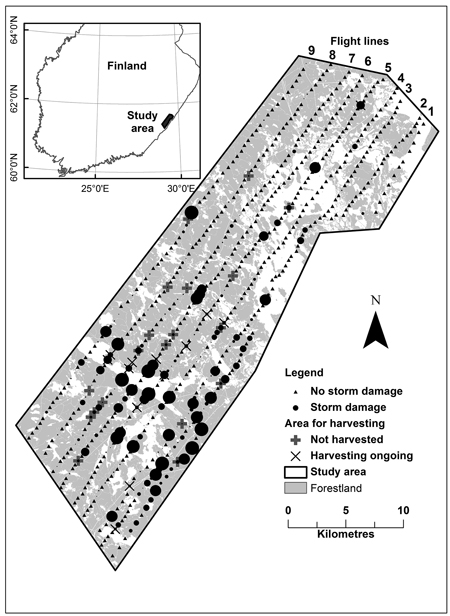
Fig. 1. Study area indicating flight lines and locations of photographs. Round symbols indicate damage severity; the size of the symbol is relative to the size of the storm area on a sample plot.
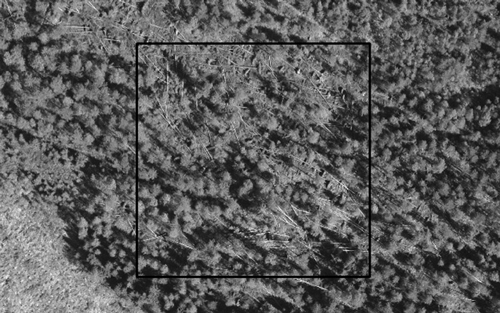
Fig. 2. Photograph taken from an altitude of 795 m. In the centre, 90 × 90 m sample plot having wind-thrown trees that need to be harvested.
| Table 1. Sample plots, amount of damaged sample plots, proportion of damage in sample plot (on average), amount of sample plots having trees and volume of trees (on a sample plot, on average) to be harvested by flight lines. | |||||
| Flight line | Sample plots | Storm damage | Not harvested | ||
| Sample plots (damaged) | Proportion of damage, % (in average) | Sample plots | m3 ha–1 (in average) | ||
| 1 | 29 | 13 | 49.6 | 2 | 9.1 |
| 2 | 70 | 28 | 36.4 | 2 | 8.1 |
| 3 | 86 | 28 | 28.3 | 3 | 19.8 |
| 4 | 87 | 25 | 25.6 | 2 | 33.0 |
| 5 | 90 | 26 | 35.6 | 4 | 27.6 |
| 6 | 84 | 18 | 45.8 | 5 | 8.6 |
| 7 | 79 | 28 | 21.8 | 6 | 2.0 |
| 8 | 78 | 19 | 22.3 | 3 | 44.1 |
| 9 | 70 | 18 | 22.2 | 1 | 1.4 |
| In total | 673 | 203 | 28 | ||
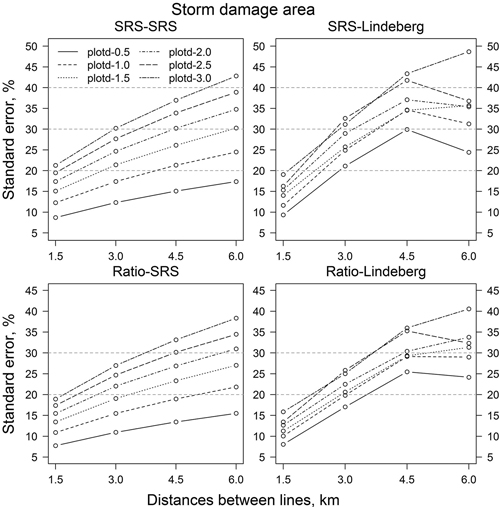
Fig. 3. Relative standard errors of storm-damaged area estimates of resampling with different estimation methods and parameters. “SRS-SRS” means simple random sampling estimator, “SRS-Lindeberg” simple random sampling estimator using Lindeberg’s adjacent line method. “Ratio-SRS” simple random sampling ratio estimator and “Ratio-Lindeberg” simple random sampling ratio estimator using Lindeberg’s adjacent line method. “plotd-0.5” means 0.5 kilometre distance between photographs on flight line, “plotd-1.0” one kilometre distance, etc.
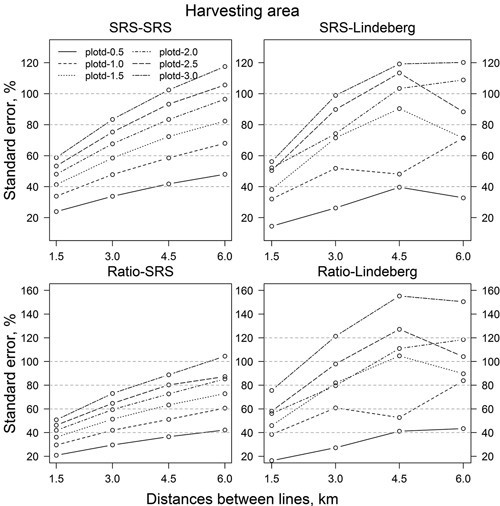
Fig. 4. Standard errors (%) of estimated harvesting area in resampling with different estimation methods and parameters. Abbreviations are as in Fig. 3.
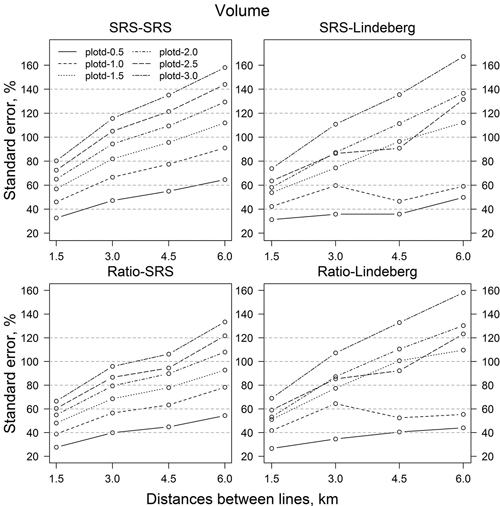
Fig. 5. Standard errors (%) of volume of wind-thrown trees for harvesting estimates with different resampling methods and parameters. Abbreviations are as in Fig. 3.
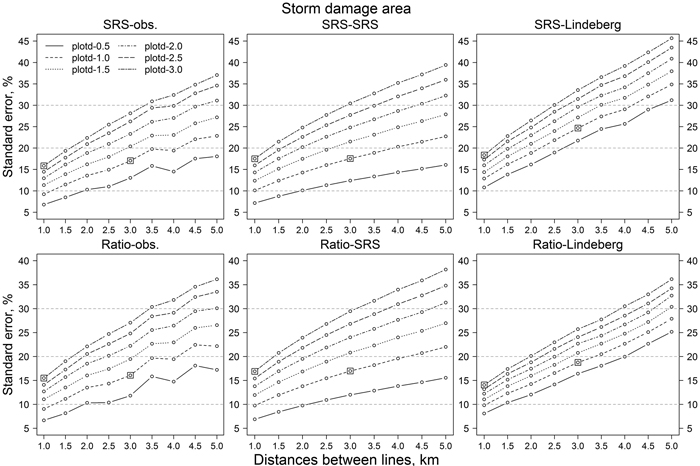
Fig. 6. Relative standard errors of storm-damaged area estimates of simulations with different estimation methods and parameters. “SRS-obs.” means variation calculated from the observed values. Squares illustrate the combination of line and plot distance of 1 km by 3 km and 3 km by 1 km, respectively. Other abbreviations are as in Fig. 3.
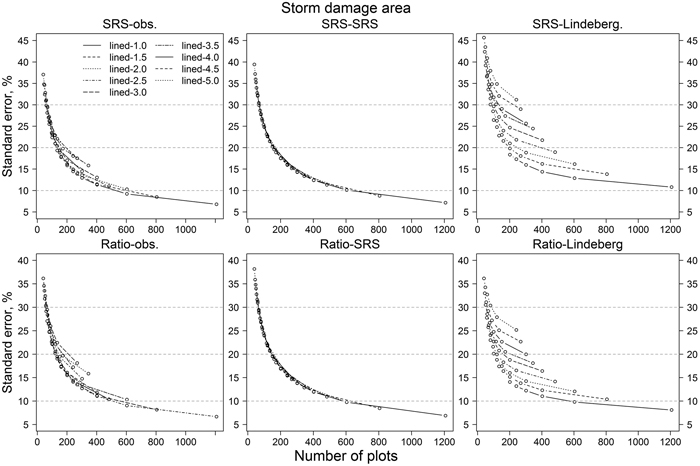
Fig. 7. The effect of number of sample plots on relative standard errors of storm-damaged area estimates in simulations. “lined-1.0” means 1 kilometre distance between lines, “lined-1.5” 1.5 kilometre distance, etc. Abbreviations are as in Fig. 6.
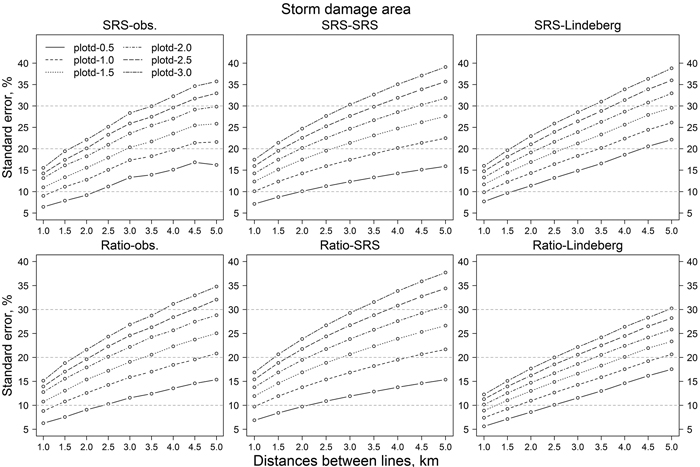
Fig. 8. Relative standard errors of storm-damaged area estimates of simulations with different estimation methods and parameters with dataset from lines turned 90-degrees compared to original lines direction. Abbreviations are as in Fig. 6.
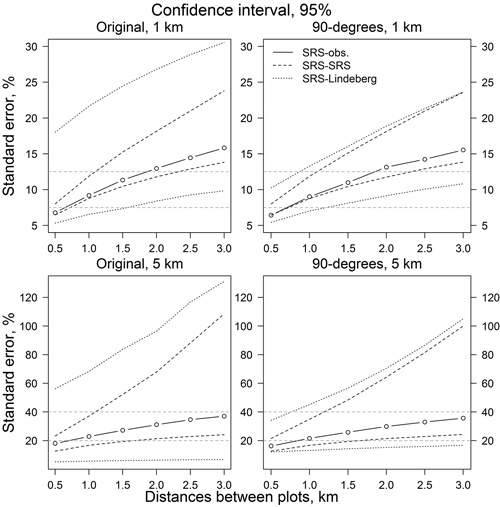
Fig. 9. Confidence intervals for relative standard error of SRS-SRS and SRS-Lindeberg’s estimates. Original line direction for 1 and 5 km line distances (left) and perpendicular to the original line direction (right). Legend abbreviations are as in Fig. 6.
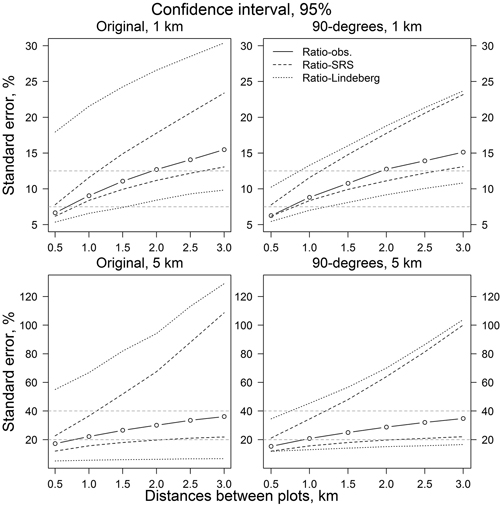
Fig. 10. Confidence intervals for relative standard error of Ratio and Lindeberg’s estimates. Original line direction for 1 and 5 km line distances (left) and perpendicular to the original line direction (right). Legend abbreviations are as in Fig. 6.