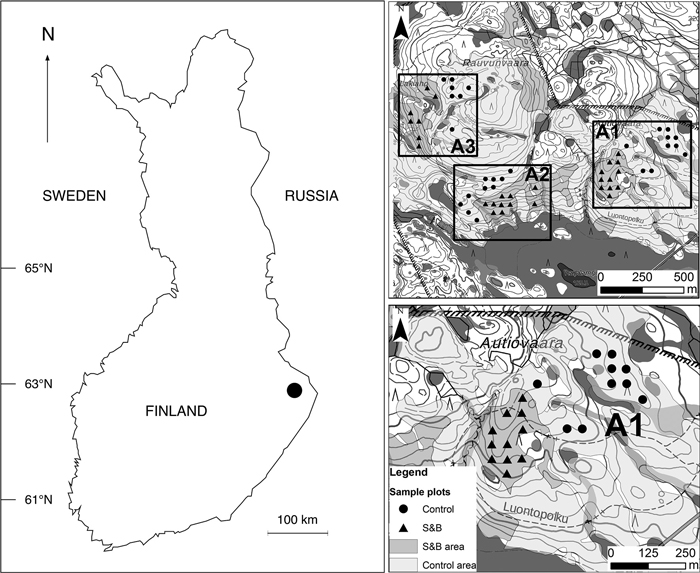
Fig. 1. Location of Autiovaara study area in Finland and the layout of sample plots in the terrain. S&B = slash-and-burn; A1, A2, A3 = separate areas in the terrain, where in each there was one slash-and-burn and one control subarea with several sample plots within. Contains data from the National Land Survey of Finland Basic Map Raster 06/2015.
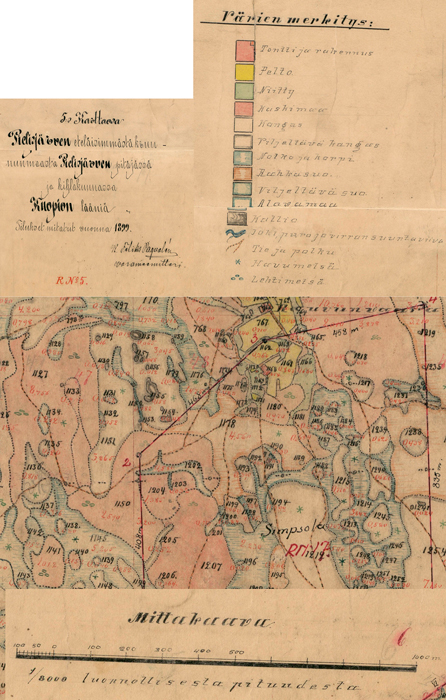
Fig. 2. Example of the old land use map. North-Karelian land survey bureau archive, Lieksa. Map unit 5. Pielisjärvi southernmost crownland, Reg. No. 29:5, PKMMKA 1899. Värien merkitys = legend: tontti ja rakennus = land parcel and building, pelto = field, niity = meadow, kaskimaa = slash-and-burn land, kangas = pine forest, viljeltävä kangas = upland forest suitable for agriculture, notko ja korpi = glen and spruce forest, rahkasuo = Sphagnum bog, viljeltävä suo = peatland suitable for agriculture, alavamaa = lowland, kallio = rock surface, joki, puro ja virran suuntaviiva = river, creek and the direction of the stream, tie ja polku = road and trail, havumetsä = coniferous forest, lehtimetsä = deciduous forest. Mittakaava = scale. View larger in new window/tab.
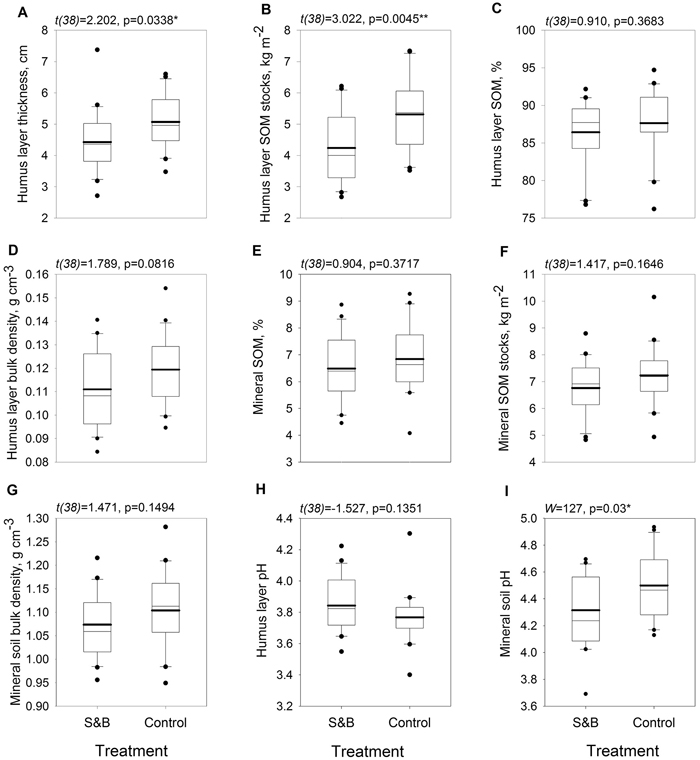
Fig. 3. Boxplots for soil parameters within slash-and-burn (S&B) and control areas with a thicker mean line: A = soil organic hemic and sapric, i.e. Oe/Oa (humus layer) thickness, cm; B = humus layer soil organic matter (SOM) stocks, kg m–2; C = humus layer SOM concentration, mass %; D = humus layer bulk density, g cm–3; E = uppermost 10 cm mineral SOM concentration, mass %; F = uppermost 10 cm mineral SOM stocks, kg m–2; G = uppermost 10 cm mineral soil bulk density, g cm–3; H = humus layer pH; I = uppermost 10 cm mineral soil pH. Test statistic and p-value for between-treatment differences given above the boxplot graphs. Significance levels: * = p < 0.05, ** = p < 0.005.
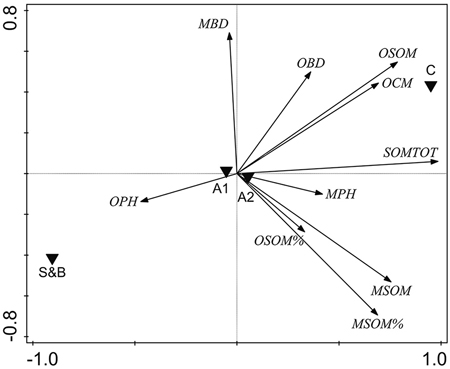
Fig. 4. Unconstrained PCA ordination of soil parameter data with two sampling areas and treatment types added as environmental variables. OPH = organic hemic and sapric, i.e. Oe/Oa (humus layer) pH; MBD = uppermost 10 cm mineral soil bulk density, g cm–3; OBD = humus layer bulk density, g cm–3; OSOM = humus layer soil organic matter stock, kg m–2; OCM = humus layer thickness, cm; SOMTOT = combined humus layer and uppermost 10 cm mineral SOM stock, kg m–2; MPH = uppermost 10 cm mineral soil pH; MSOM = uppermost 10 cm mineral SOM stock, kg m–2; MSOM% = uppermost 10 cm mineral SOM mass concentration percentage; OSOM% = humus layer SOM mass concentration percentage. S&B = slash-and-burn treatment; C = control treatment; A1, A2 = two sampling areas in the terrain, in each of which there was one slash-and-burn and one control sampled subarea.
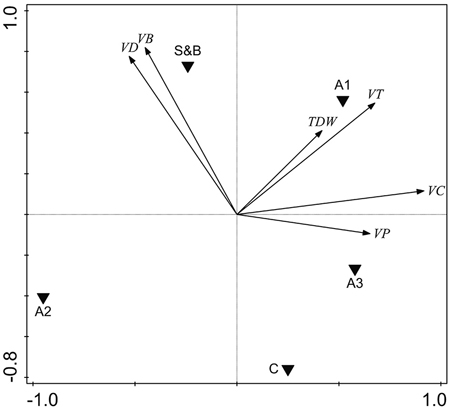
Fig. 5. Unconstrained PCA ordination of tree parameter data with three sampling areas and two treatment types added as environmental variables. VD = living deciduous tree volume, m3 ha–1; VB = living birch (Betula pendula and B. pubescens) volume, m3 ha–1; TDW = total dead wood volume, m3 ha–1; VT = total living tree volume, m3 ha–1, VC = living conifer tree volume, m3 ha–1; VP = living pine (Pinus sylvestris) volume, m3 ha–1. S&B = slash-and-burn treatment, C = control treatment; A1, A2, A3 = three sampling areas in the terrain, in each of which there was one slash-and-burn and one control sampled subarea.
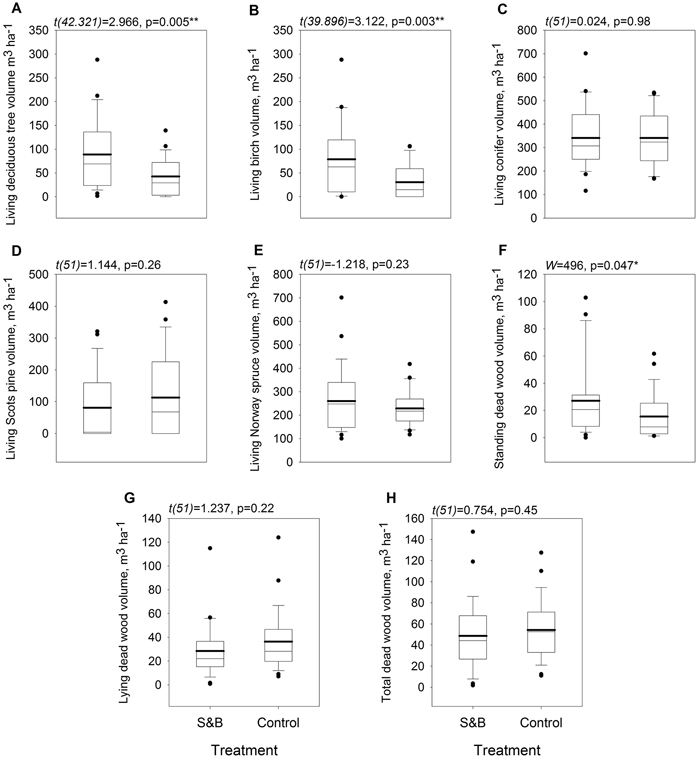
Fig. 6. Boxplots for tree stand parameters within slash-and-burn (S&B) and control areas with a thicker mean line: A: living deciduous tree volume, m3 ha–1; B: living birch (Betula pendula and B. pubescens) volume m3 ha–1; C: living coniferous tree volume, m3 ha–1; D: living Scots pine (Pinus sylvestris) volume, m3 ha–1; E: living Norway spruce (Picea abies) volume, m3 ha–1; F: standing dead wood volume, m3 ha–1; G: lying dead wood volume, m3 ha–1; H: total dead wood volume, m3 ha–1. Test statistic and p-value for between-treatment differences given above the boxplot graphs. Significance levels: * = p < 0.05, ** = p < 0.005.
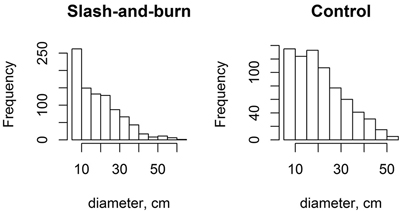
Fig. 7. Histograms for tree diameter at breast height (DBH) distributions (pooled data) for slash-and-burn and control sites.
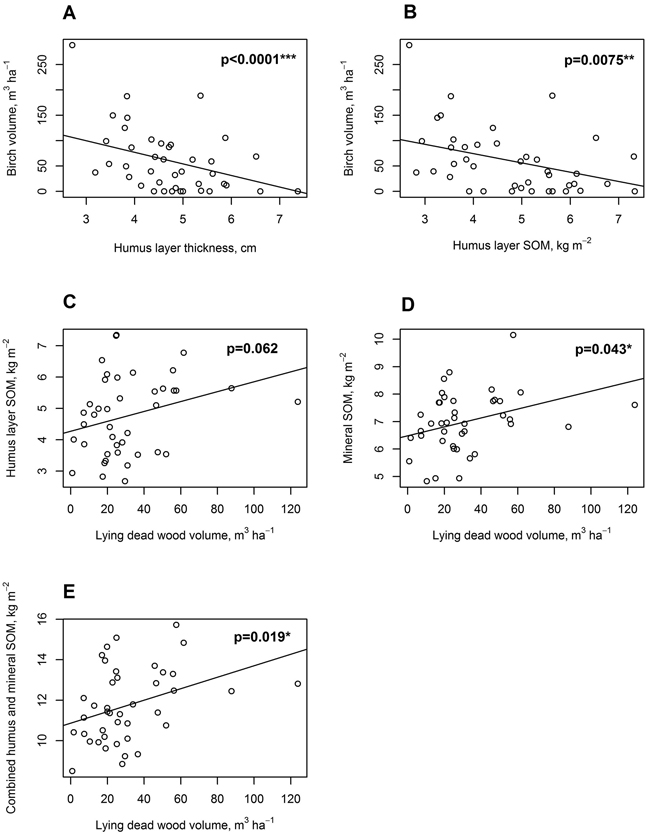
Fig. 8. Linear mixed-effects model regressions for soil, tree stand and dead wood parameters. A: Live standing birch volume, m3 ha–1, regressed on organic hemic and sapric, i.e. Oe/Oa horizon (humus layer) thickness, cm; B: Live standing birch volume, m3 ha–1, regressed on humus layer soil organic matter (SOM), kg m–2; C: Humus layer SOM, kg m–2 regressed on lying dead wood volume, m3 ha–1; D: Uppermost 10 cm mineral layer SOM, kg m–2, regressed on lying dead wood volume, m3 ha–1; E: Combined humus layer and uppermost 10 cm mineral layer SOM, kg m–2, regressed on lying dead wood volume, m3 ha–1.