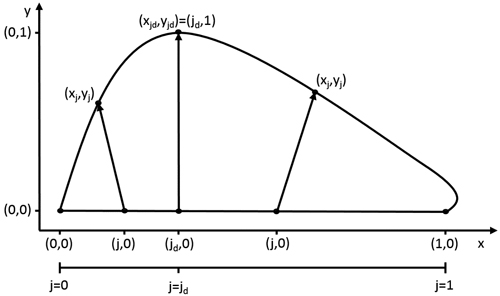
Fig. 1. The model describes the leaf outline through a transformation of every point (j,0) on the leaf midrib. The size and orientation of these transformation vectors are dependent on the value of j. At the point of maximal width jd, the size of the this vector is 1 and its slope 0.
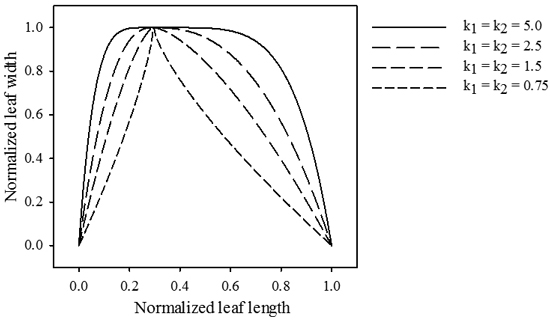
Fig. 2. Influence of parameters k1 and k2 on the relative length of the transformation vector across the leaf midrib. jd = 0.3, b1 = b2 = 0.
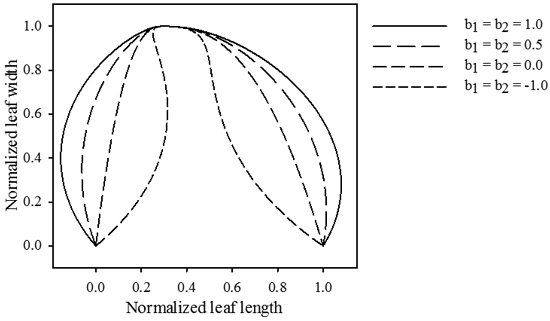
Fig. 3. Influence of parameters b1 and b2. The magnitude of these parameters determines the size of the formed extrusions. Positive values cause the leaf to push outwards, while negative values cause an inwards movement. jd = 0.3 , k1 = k2 = 2.5, p1 = p2 = 2.5.
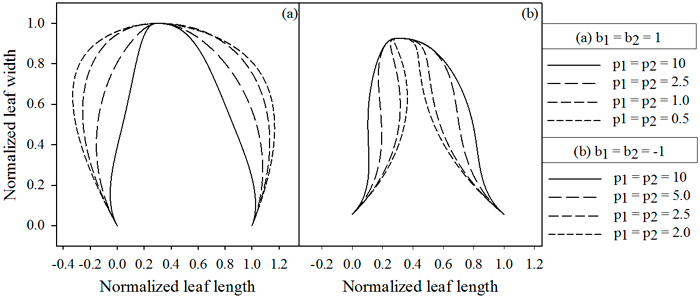
Fig. 4. Influence of parameters p1 and p2, which depend on the value of b. (A) b = 1, (B) b = –1. Lowering the parameter values cause the extrusions to move away from the midrib, while higher values cause them to move towards the midrib. jd = 0.3 , k1 = k2 = 2.5.
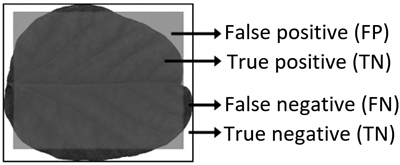
Fig. 5. Illustrative example of model performance criterion areas when a leaf is classified as a square.
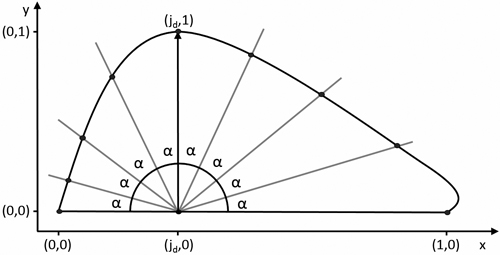
Fig. 6. Definition of pseudo-landmarks for calculating the mean leaf shape. α = ![]() with n + 1 the amount of pseudo-landmarks.
with n + 1 the amount of pseudo-landmarks.
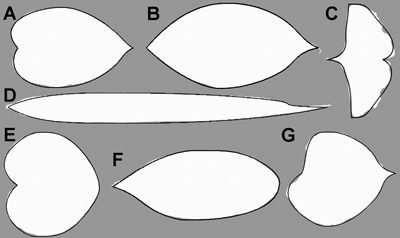
Fig. 7. Optimised model description (solid line) of a random leaf sample in all seven tree species (Mallah et al. 2013): Alnus cordata (A), Cornus kousa (B), Ginkgo biloba (C), Arundinaria simonii (D), Cercis siliquastrum (E), Argyrocytisus battandieri (F) and Tilia oliveri (G) plotted on the original data (white mask image).
| Table 1. Comparison of the normalised area of the leaves of the seven selected tree species with their respective model fits. The accuracy of the model fit as defined in Eq. 6 is also given for each species. | |||
| Species name | Area (Data) Mean – [95% CI] | Area (Fit) Mean – [95% CI] | Accuracy Mean – [95% CI] |
| Alnus cordata | 0.746 [0.710–0.800] | 0.748 [0.712–0.801] | 0.984 [0.980–0.987] |
| Arundinaria simonii | 0.719 [0.684–0.784] | 0.718 [0.683–0.779] | 0.978 [0.970–0.984] |
| Cercis siliquastrum | 0.934 [0.868–1.057] | 0.936 [0.871–1.053] | 0.982 [0.974–0.988] |
| Cornus kousa | 0.648 [0.623–0.688] | 0.646 [0.621–0.687] | 0.989 [0.986–0.992] |
| Argyrocytisus battandieri | 0.714 [0.692–0.731] | 0.711 [0.689–0.725] | 0.987 [0.983–0.991] |
| Ginkgo biloba | 0.735 [0.618–0.879] | 0.726 [0.614–0.864] | 0.956 [0.941–0.972] |
| Tilia oliveri | 0.749 [0.720–0.789] | 0.754 [0.724–0.794] | 0.976 [0.970–0.980] |
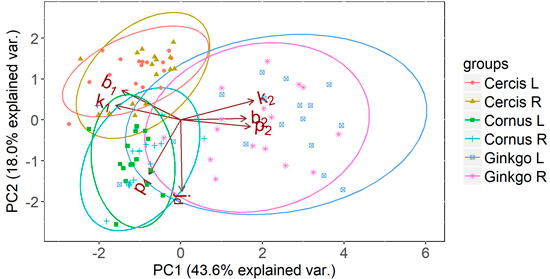
Fig. 8. Principal component analysis (PCA) on the parameters of the half leaf samples (where L and R represent the left and right side of the leaf respectively) of Cornus, Cercis and Ginkgo indicating the principal shape differences between groups expressed in relative difference in shape parameters. The ellipses represent the 95% confidence intervals for each group. Overlapping ellipses indicate similarity between groups, and point to symmetry in the leaves.
| Table 2. Comparison of the mean normalised area of the leaves of the seven selected tree species with the normalised area of the calculated mean leaf shape for each group. | |||
| Species name | Mean area (Data) | Area mean shape | Relative difference in area |
| Alnus cordata | 0.746 | 0.745 | –0.13% |
| Arundinaria simonii | 0.719 | 0.708 | –1.59% |
| Cercis siliquastrum | 0.934 | 0.931 | –0.35% |
| Cornus kousa | 0.648 | 0.641 | –1.15% |
| Argyrocytisus battandieri | 0.714 | 0.708 | –0.82% |
| Ginkgo biloba | 0.735 | 0.707 | –3.82% |
| Tilia oliveri | 0.749 | 0.742 | –0.93% |