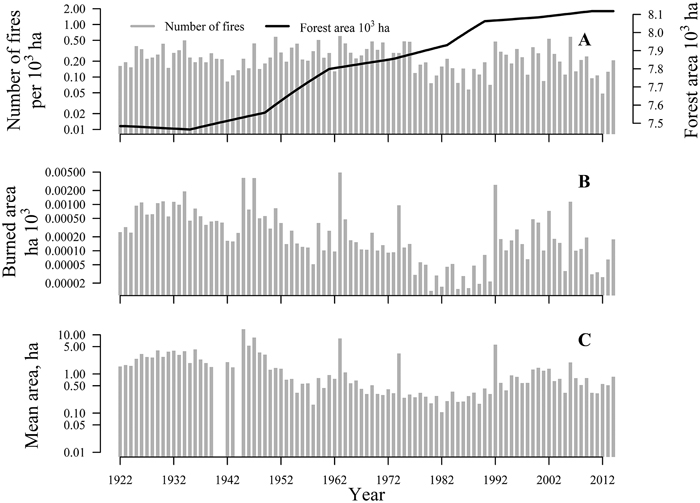
Fig. 1. The area of forest land, number of forest fires (A), burned area (B), and the mean fire size (C) in Latvia during the period 1922–2014. Note that the y-axes are logarithmic.
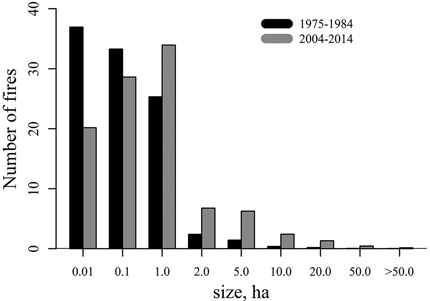
Fig. 2. Distribution of mean fire size classes for the periods 1975–1984 and 2004–2014.
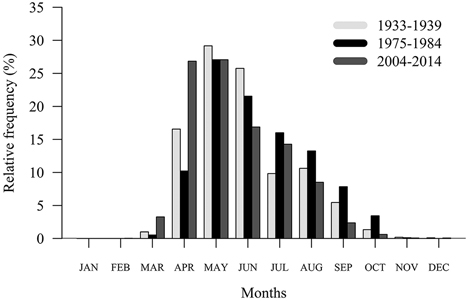
Fig. 3. Monthly distribution of fire occurrence in the periods 1933–1939, 1975–1984, and 2007–2014.
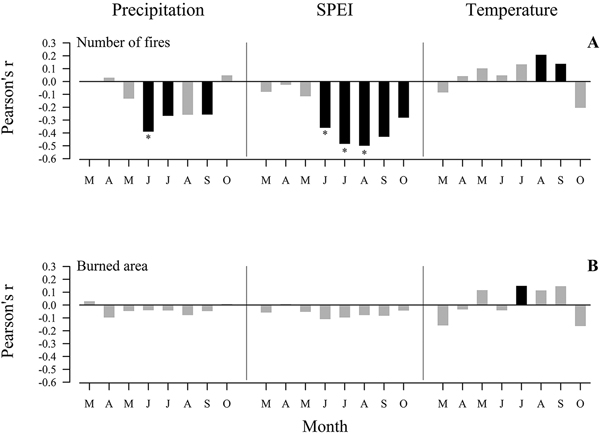
Fig. 4. Response function (asterisk) and Pearson’s correlation (bars) coefficients between fire activity and climatic variables: monthly cumulative precipitation, mean temperature, and standardised precipitation evotranspiration index (SPEI) for the period 1923–2012. Significant correlations (at α= 0.05) are shown in black; asterisk indicate significant (at α= 0.05) response function coefficient.
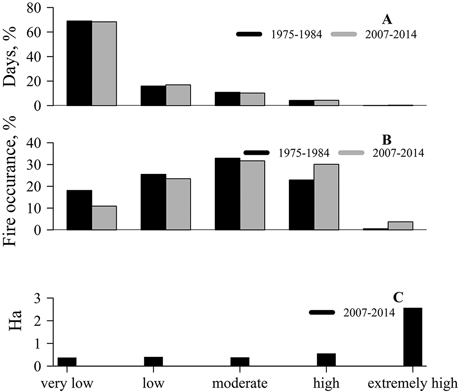
Fig. 5. Distribution of days (A) and fire occurrence (B) in the Canadian Fire Weather Index (FWI) danger classes during 1975–1984 and 2007–2014. Distribution of mean fire size (C) in the FWI danger classes during 2007–2014.
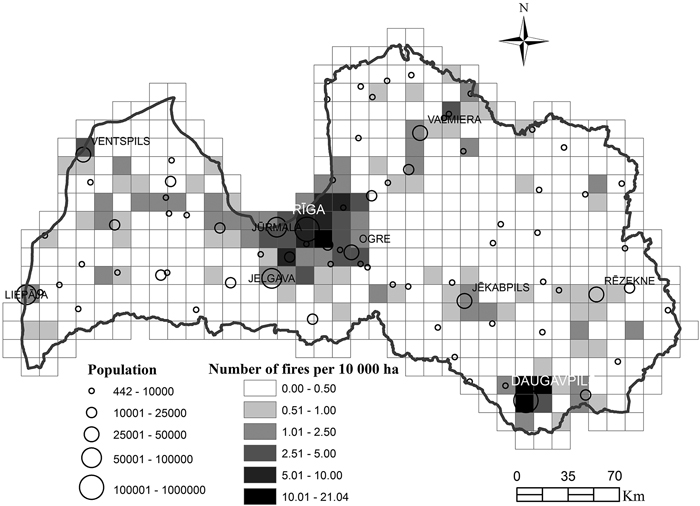
Fig. 6. The spatial clustering pattern of forest fire occurrence per 100 00 ha per year 2007–2014.