| Table 1. Numbers of sites inventoried in each year by age since clearfelling (1 year old = 2nd season after harvesting). | ||||
| Year | 1 year old | 2 year old | 3 year old | Total |
| 2006 | 2 | 21 | 3 | 26 |
| 2007 | 2 | 13 | 10 | 25 |
| 2008 | 7 | 18 | 8 | 33 |
| 2009 | 5 | 53 | 30 | 87 |
| 2010 | 22 | 48 | 23 | 93 |
| 2011 | 5 | 6 | 16 | 27 |
| Total | 43 | 158 | 89 | 292 |
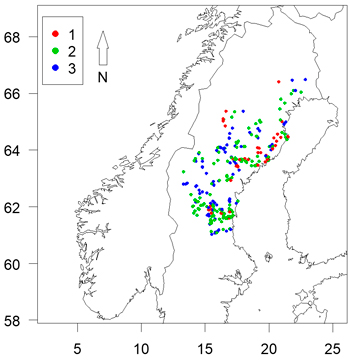
Fig. 1. Locations of sites assessed coloured by clear-cut age. Axes show longitude and latitude.
| Table 2. Potential independent variables. | |
| Variable | Range or categories |
| Coordinate RT90* East/West | 1373546 to 1813800 |
| Coordinate RT90 North/South | 6767903 to 7393400 |
| Coast distance | 1 to 240 km |
| Elevation | 7 to 660 m above mean sea level |
| Temperature sum | 548.9 to 1267.7 degree days above 5 °C per year |
| Clear-cut age | 1, 2 or 3 years |
| Site index | T14 to T24 for pine and G14 to G28 for spruce (height in m after 100 years) |
| Tree species | Norway spruce, Scots pine or lodgepole pine |
| Stoniness | None, light, medium or heavy |
| Site preparation | Disc trenching, patch scarification or mounding |
| Mineral soil on site | 0% to 88% of planted seedlings surrounded by pure mineral soil |
| * RT90 is a coordinate reference system with the following prog4string: +proj=tmerc +lat_0=0 +lon_0=15.80827777777778 +k=1 +x_0=1500000 +y_0=0 +ellps=bessel +units=m +no_defs | |
| Table 3. Simple correlations between variables. Numbers in bold are statistically significant. | |||||||||
| Prob. attack | Clear-cut age | Mineral soil | Elevation | Coast distance | Temp. sum | Coordinate E/W | Coordinate N/S | Stoniness | |
| Prob. attack | 1 | –0.14226 | –0.39653 | –0.40913 | –0.43813 | 0.418602 | 0.279088 | –0.08671 | 0.158614 |
| Clear-cut age | –0.14226 | 1 | 0.098893 | 0.137607 | 0.218259 | –0.07446 | –0.22084 | –0.09351 | –0.01117 |
| Mineral soil | –0.39653 | 0.098893 | 1 | 0.354485 | 0.395688 | –0.41492 | –0.18979 | 0.168581 | –0.15065 |
| Elevation | –0.40913 | 0.137607 | 0.354485 | 1 | 0.800851 | –0.84688 | –0.70949 | –0.14989 | –0.00517 |
| Coast dist. | –0.43813 | 0.218259 | 0.395688 | 0.800851 | 1 | –0.79097 | –0.66678 | 0.088094 | –0.01271 |
| Temp. sum | 0.418602 | –0.07446 | –0.41492 | –0.84688 | –0.79097 | 1 | 0.305601 | –0.39451 | 0.042062 |
| Coordinate E/W | 0.279088 | –0.22084 | –0.18979 | –0.70949 | –0.66678 | 0.305601 | 1 | 0.661445 | –0.05927 |
| Coordinate N/S | –0.08671 | –0.09351 | 0.168581 | –0.14989 | 0.088094 | –0.39451 | 0.661445 | 1 | –0.07265 |
| Stoniness | 0.158614 | –0.01117 | –0.15065 | –0.00517 | –0.01271 | 0.042062 | –0.05927 | –0.07265 | 1 |
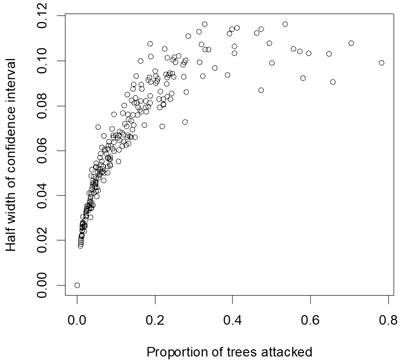
Fig. 2. Half width of confidence interval (α = 0.05) for estimates of proportion of seedlings attacked by pine weevils.
| Table 4. Regression model with proportion of seedlings attacked (λ = 0.39) as the dependent variable. If a λ-value is shown then this indicates the variable was subjected to a scaled power transformation. All interactions were made with transformed values. AIC = 349. Probabilities in bold are statistically significant. | ||||
| Variable | λ-value | Coefficient | Standard error | P-value |
| Intercept | 2.308e+04 | 1.477e+04 | 0.119299 | |
| Clear-cut age | 0.30 | –3.583e–01 | 1.387e–01 | 0.010276 |
| Proportion mineral soil | 0.70 | 3.740e–02 | 2.248e–02 | 0.097375 |
| Temperature sum | 1.49 | –2.110e+00 | 7.051e–01 | 0.003013 |
| Latitude | –2.00 | –4.618e+04 | 2.955e+04 | 0.119253 |
| Clear-cut age × Mineral soil | 1.824e–02 | 8.515e–03 | 0.033027 | |
| Mineral soil × Temp. sum | 6.809e–02 | 1.860e–02 | 0.000299 | |
| Latitude × Temp. sum | 4.221e+00 | 1.411e+00 | 0.003011 | |
| Mineral soil × Latitude × Temp. sum | –1.362e–01 | 3.720e–02 | 0.000299 | |
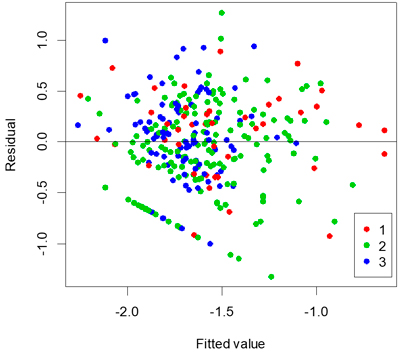
Fig. 3. Residuals versus fitted values coloured by age of clear-cut.
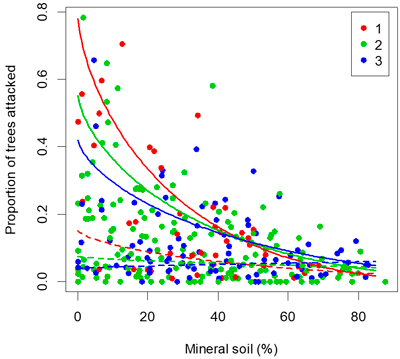
Fig. 4. Proportion of seedlings attacked by pine weevils versus proportion of seedlings planted in pure mineral soil. Lines show the fit of the multi-linear regression. The maximum temperature sum (1267 degree-days) is shown in full lines and the 25th percentile (909 degree-days) is shown with dashed lines. The colour of each point indicates the number of years since clearfelling.
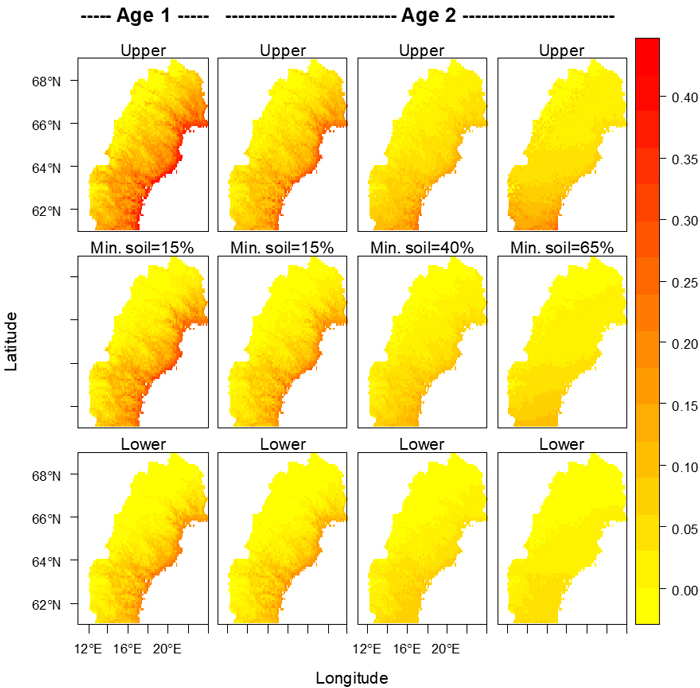
Fig. 5. Proportions of seedlings attacked by pine weevils for clear-cut ages 1 and 2 for several percentages (shown above each column of maps) of seedlings with mineral soil around their bases. The middle row shows the model’s expected values, and the upper and lower 95% confidence limits are shown in the upper and lower rows respectively. Maps were created using R (R Core Development Team 2004). Alpine areas devoid of trees were assumed to be those areas with a mean temperature between May 1st and September 30th less than 7.5 °C (Körner 1998), and in all maps the risk in those areas was set to zero.
| Table 5. Regression model with proportion of attacked seedlings that died (λ = 1.275) as the dependent variable. If a λ-value is shown then this indicates the variable was subjected to a scaled power transformation. All interactions were made with transformed values. “% in mineral soil” is the percentage of seedlings at each site with a surround of mineral soil. | ||||
| Variable | λ-value | Coefficient | Standard error | P-value |
| Intercept | –0.189616 | 0.031980 | 1.61e–07 | |
| % in mineral soil | 0.70 | –0.012979 | 0.003085 | 8.76e–05 |
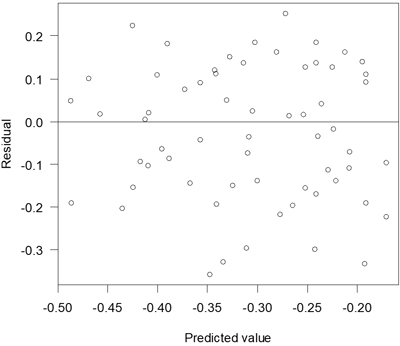
Fig. 6. Residuals versus predicted values for the model of death due to pine weevil attack.
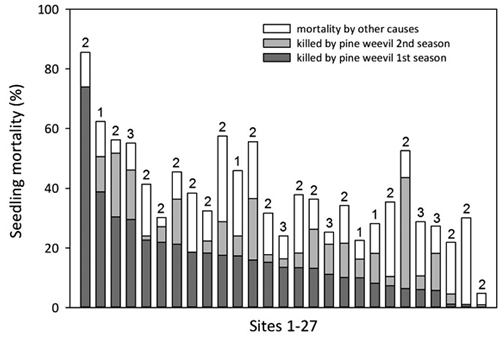
Fig. 7. Proportion of seedlings killed by pine weevil after one and two seasons, and total seedling mortality after two seasons on 27 sites (scattered from south to north but all within 100 km from the coast). Sites are arranged in decreasing order according to the proportion of seedlings killed by pine weevil the first season. Numbers above bars (1–3) denote the age of the clear-cut.