| Table 1. Local weighting (LW)a and global weighting (GW) of SWOT factors of NIFMS transfer to Karelia (the factors are ranked in decreasing order from highest to lowest weightings with respect to each SWOT group, the factor with the higher weighting is located above others) (CR is the consistency index per SWOT group)b. | |||||
| Strengths (CR = 0.060) | LW | GW | Weaknesses (CR = 0.059) | LW | GW |
| Improving productivity and quality of timber | 0.292 | 0.116 | Slow return on investments | 0.342 | 0.059 |
| Support for principles of sustained yield | 0.262 | 0.104 | High cost for young forest thinning | 0.185 | 0.032 |
| Better forest road network | 0.120 | 0.048 | Low market demand for energy wood | 0.184 | 0.032 |
| Contribution to municipal and regional economy | 0.119 | 0.047 | High demand for skilled specialists | 0.169 | 0.029 |
| Employment development | 0.116 | 0.046 | Lack of investments in R&D | 0.120 | 0.021 |
| Improving forest health and fire control | 0.091 | 0.036 | |||
| Opportunities (CR = 0.064) | LW | GW | Threats (CR = 0.071) | LW | GW |
| High potential of forest resource | 0.308 | 0.055 | Unprepared regulatory environment | 0.311 | 0.077 |
| Proven Nordic expertise | 0.221 | 0.040 | Insecurity of private investments | 0.185 | 0.046 |
| Authority programs for forest sector development | 0.196 | 0.035 | Low forest road density and quality | 0.160 | 0.040 |
| Wood-based energy development | 0.145 | 0.026 | Low profitability in forestry | 0.101 | 0.025 |
| Availability of new technology | 0.129 | 0.023 | High investment cost | 0.088 | 0.022 |
| Negative attitude to intensive forestry | 0.082 | 0.021 | |||
| Forest degradation | 0.072 | 0.018 | |||
| a The group priority was calculated as following: Strengths 0.398; Weaknesses 0.174; Opportunities 0.180; Threats 0.249. b The consistency ratio (CR) of the comparisons between four SWOT groups was 0.043. | |||||
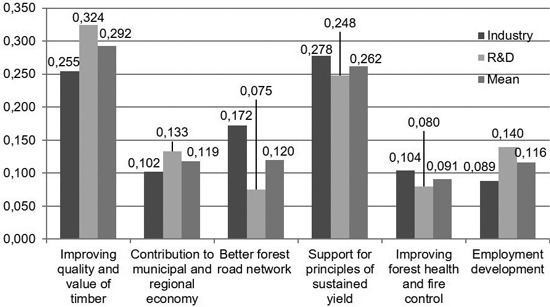
Fig. 1. Descriptive statistics for local weightings (LW) for strengths by respondent group obtained with the analytic hierarchy process (AHP) procedure.
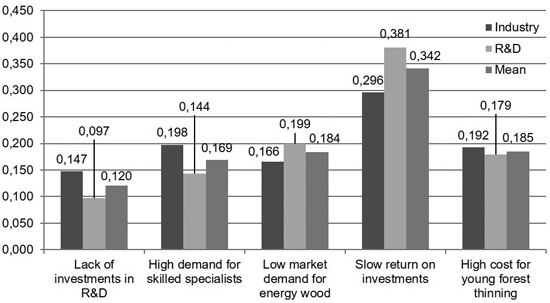
Fig. 2. Descriptive statistics for local weightings (LW) for weaknesses by respondent group obtained with the analytic hierarchy process (AHP) procedure.
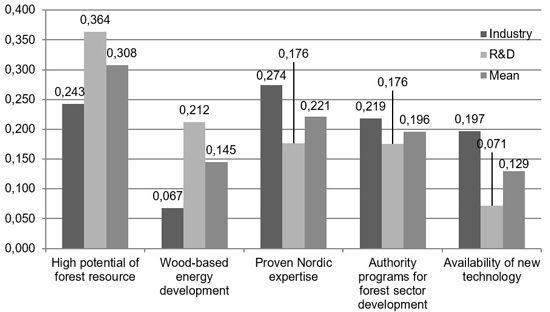
Fig. 3. Descriptive statistics for local weightings (LW) for opportunities by respondent group obtained with the analytic hierarchy process (AHP) procedure.
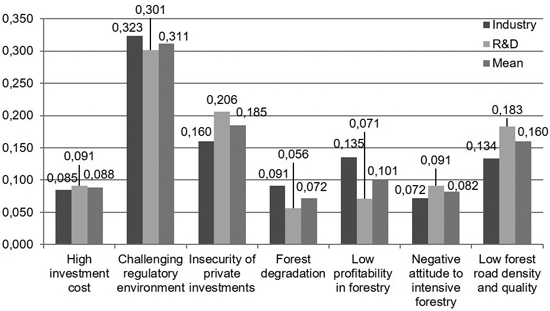
Fig. 4. Descriptive statistics for local weightings (LW) for threats by respondent group obtained with the analytic hierarchy process (AHP) procedure.
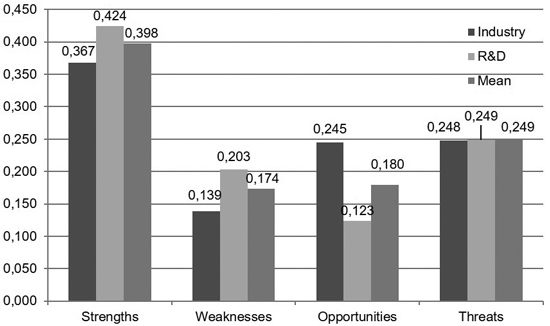
Fig. 5. Descriptive statistics for local weightings (LW) for the SWOT groups by respondent group obtained with the analytic hierarchy process (AHP) procedure.
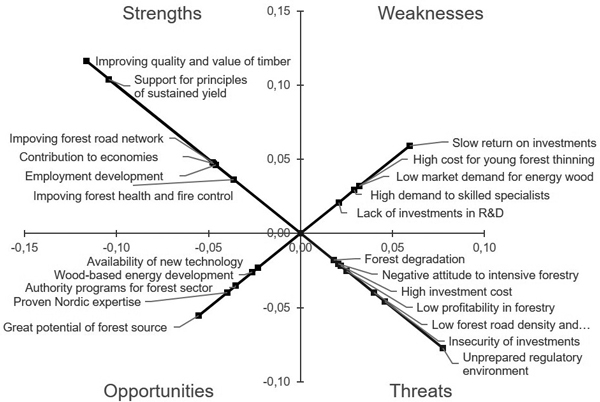
Fig. 6. Graphical interpretation of the global priorities for factors with respect to each SWOT group (the higher the priority, the outermost the point).