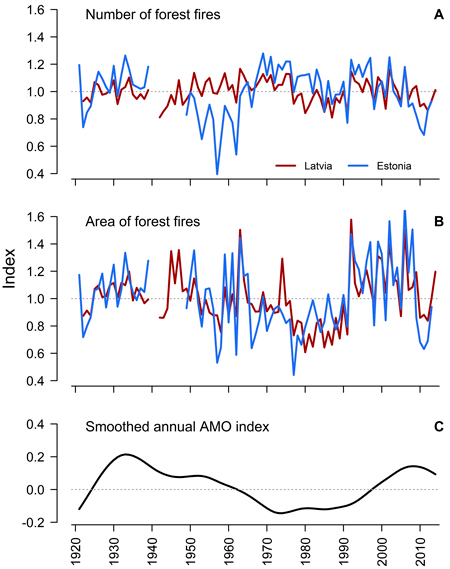
Fig. 1. Chronologies of number (A) and area (B) of forest fires in Latvia and Estonia, and smoothed annual Atlantic Multidecadal Oscillation index (C).
| Table 1. Pearson correlation (upper diagonal part shows coefficients, lower diagonal part shows their p-values) and synchrony coefficients calculated between chronologies of number and area of forest fires (per unit of area) in Latvia and Estonia for the period 1922–2014 and 1921–2013, respectively. | |||||
| Pearson correlation coefficient | |||||
| Latvia | Estonia | ||||
| Number | Area | Number | Area | ||
| Latvia | Number | ***** | 0.70 | 0.43 | 0.60 |
| Area | <0.001 | ***** | 0.29 | 0.74 | |
| Estonia | Number | <0.001 | 0.02 | ***** | 0.38 |
| Area | <0.001 | <0.001 | 0.01 | ***** | |
| +Synchrony coefficient | |||||
| Latvia | Estonia | ||||
| Number | Area | Number | Area | ||
| Latvia | Number | ***** | 0.82 | 0.80 | 0.77 |
| Area | ***** | 0.64 | 0.67 | ||
| Estonia | Number | ***** | 0.78 | ||
| Area | ***** | ||||
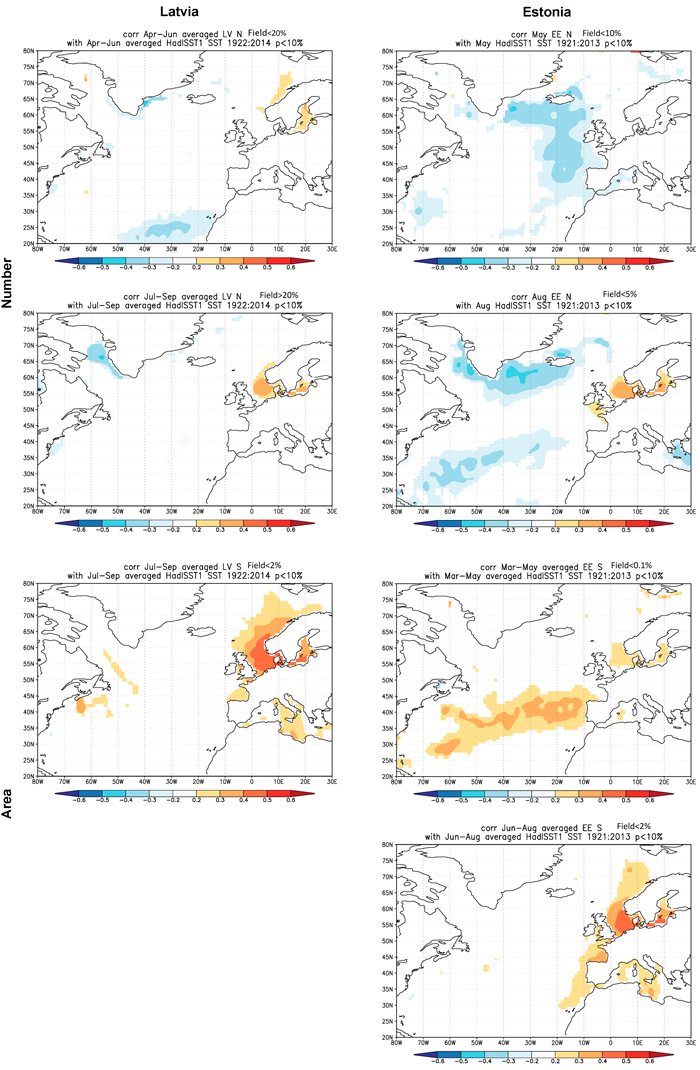
Fig. 2. Correlation between the sea surface temperature and chronologies of number and area of forest fires in Latvia and Estonia during the periods of 1922–2014 and 1921–2013, respectively. Only the months showing the highest correlations with the chronologies are plotted. Field significance are plotted. Correlations significant at p-value < 0.10 are marked with colour. View larger in new window/tab