| Table 1. Information on the crosses conducted in the Ahvenlampi Scots pine seed orchard in 2013. Grafts of three maternal genotypes were cross-pollinated with pollen from seven paternal genotypes from two other Scots pine orchards and pollen from surrounding forests. The cross-combinations with the original genotype codes, the genotype provenance effective temperature sums (d.d.) plus latitudes and the genotype codes applied in the tables and figures are listed. The letters of the genotype codes denote the following: E, K and P = southern, central and northern Finland, respectively; M = maternal genotype; S = southern paternal genotype; N = northern paternal genotype; OP = southern pollen mixture from forests surrounding the orchard of the controlled crosses. | ||||
| Cross-combination maternal * paternal genotype with the original codes | Maternal genotype provenance d.d. and (latitude) | Paternal genotype provenance d.d. and (latitude) | Applied maternal genotype code | Applied paternal genotype code |
| K205 Open pollinated | 1095 (62°34´) | 1075 (62°45´) | M1 | OP |
| K205 * K543 | 1095 (62°34´) | 1049 (62°50´) | M1 | S1 |
| K205 * K652 | 1095 (62°34´) | 1112 (62°22´) | M1 | S2 |
| K205 * K890 | 1095 (62°34´) | 1090 (62°50´) | M1 | S3 |
| K205 * P573 | 1095 (62°34´) | 692 (68°33´) | M1 | N1 |
| K205 * P575 | 1095 (62°34´) | 692 (68°33´) | M1 | N2 |
| K205 * P577 | 1095 (62°34´) | 692 (68°33´) | M1 | N3 |
| K205 * P625 | 1095 (62°34´) | 692 (68°33´) | M1 | N4 |
| K214B Open pollinated | 1117 (62°37´) | 1075 (62°45´) | M2 | OP |
| K214B * K543 | 1117 (62°37´) | 1049 (62°50´) | M2 | S1 |
| K214B * K652 | 1117 (62°37´) | 1112 (62°22´) | M2 | S2 |
| K214B * K890 | 1117 (62°37´) | 1090 (62°50´) | M2 | S3 |
| K214B * P573 | 1117 (62°37´) | 692 (68°33´) | M2 | N1 |
| K214B * P575 | 1117 (62°37´) | 692 (68°33´) | M2 | N2 |
| K214B * P577 | 1117 (62°37´) | 692 (68°33´) | M2 | N3 |
| K214B * P625 | 1117 (62°37´) | 692 (68°33´) | M2 | N4 |
| E2856 Open pollinated | 1142 (62°02´) | 1075 (62°45´) | M3 | OP |
| E2856 * K543 | 1142 (62°02´) | 1049 (62°50´) | M3 | S1 |
| E2856 * K652 | 1142 (62°02´) | 1112 (62°22´) | M3 | S2 |
| E2856 * K890 | 1142 (62°02´) | 1090 (62°50´) | M3 | S3 |
| E2856 * P573 | 1142 (62°02´) | 692 (68°33´) | M3 | N1 |
| E2856 * P575 | 1142 (62°02´) | 692 (68°33´) | M3 | N2 |
| E2856 * P577 | 1142 (62°02´) | 692 (68°33´) | M3 | N3 |
| E2856 * P625 | 1142 (62°02´) | 692 (68°33´) | M3 | N4 |
| Table 2. Information concerning the natural Scots pine forests included in this study as a source of seed material. The forest locality, latitude, effective temperature sum (d.d.) and ripening year of the seed lot are listed. | |||
| Forest locality | Latitude | d.d. | Ripening year |
| Kittilä | 67°22´ | 760 | 1988 |
| Pello | 66°48´ | 860 | 1988 |
| Puolanka | 65°05´ | 880 | 1997 |
| Pudasjärvi | 65°35´ | 900 | 1997 |
| Suomussalmi | 64°57´ | 980 | 1991 |
| Pyhäjärvi | 63°34´ | 1000 | 1997 |
| Lestijärvi | 63°39´ | 1020 | 1991 |
| Rautavaara | 63°28´ | 1050 | 2002 |
| Keuruu | 62°16´ | 1100 | 2003 |
| Korpilahti | 61°55´ | 1150 | 1997 |
| Rauma | 60°58´ | 1275 | 2002 |
| Table 3. Results from the ANOVA tests (Model 1). The tests investigated the effect of the Scots pine paternal genotype on the timing of budset (Week) and autumn frost hardening (Br %) of first-year seedlings. Model 1: Y = Intercept + M + P + M*P, where Y = Week or Br %; M = maternal genotype; P = paternal genotype. | ||||||
| Dependent variable: Week | Dependent variable: Br % | |||||
| df | F | Sig. | df | F | Sig. | |
| Corrected model | 20 | 11.058 | <0.001 | 20 | 7.264 | <0.001 |
| Intercept | 1 | 274849.954 | <0.001 | 1 | 2951.919 | <0.001 |
| Maternal genotype | 2 | 19.581 | <0.001 | 2 | 7.889 | 0.001 |
| Paternal genotype | 6 | 26.370 | <0.001 | 6 | 19.676 | <0.001 |
| Maternal genotype * Paternal genotype | 12 | 1.981 | 0.041 | 12 | 0.894 | 0.558 |
| Error | 63 | 60 | ||||
| df = the number of degrees of freedom; F = F ratio; Sig. = p-value; Week = the calendar week when the terminal buds appeared; Br % = the percentage browning of primary needles. | ||||||
| Table 4. Tukey post hoc test results for the ANOVA tests (Model 1). Pairwise comparisons of the paternal genotype effect (mean difference) on the timing of budset (Week) and autumn frost hardening (Br %) of first-year seedlings of Scots pine. OP, N1–N4 and S1–S3 are codes for the paternal genotypes. The letters of the codes denote the following: S = southern paternal genotype; N = northern paternal genotype; OP = southern pollen mixture from forests surrounding the orchard of the controlled crosses. | |||||||
| Dependent variable: Week | Dependent variable: Br % | ||||||
| (I) Paternal genotype | (J) Paternal genotype | Mean difference (I-J) | p-value | Signi- ficance | Mean difference (I-J) | p-value | Signi- ficance |
| OP | N1 | 1.313 | <0.001 | *** | 23.548 | <0.001 | *** |
| N2 | –0.077 | 1.000 | 39.812 | <0.001 | *** | ||
| N3 | 2.322 | <0.001 | *** | 24.480 | <0.001 | *** | |
| N4 | 1.199 | <0.001 | *** | 29.038 | <0.001 | *** | |
| S1 | –0.203 | 0.991 | 0.942 | 1.000 | |||
| S2 | 0.735 | 0.072 | –0.425 | 1.000 | |||
| S3 | 0.491 | 0.495 | 13.663 | 0.060 | |||
| N1 | N2 | –1.389 | <0.001 | *** | 16.264 | 0.009 | ** |
| N3 | 1.009 | 0.003 | ** | 0.933 | 1.000 | ||
| N4 | –0.113 | 1.000 | 5.490 | 0.912 | |||
| S1 | –1.516 | <0.001 | *** | –22.606 | <0.001 | *** | |
| S2 | –0.578 | 0.285 | –23.973 | <0.001 | *** | ||
| S3 | –0.822 | 0.028 | * | –9.885 | 0.358 | ||
| N2 | N3 | 2.398 | <0.001 | *** | –15.332 | 0.017 | * |
| N4 | 1.276 | <0.001 | *** | –10.774 | 0.228 | ||
| S1 | –0.127 | 1.000 | –38.870 | <0.001 | *** | ||
| S2 | 0.812 | 0.031 | * | –40.237 | <0.001 | *** | |
| S3 | 0.568 | 0.307 | –26.149 | <0.001 | *** | ||
| N3 | N4 | –1.123 | 0.001 | *** | 4.558 | 0.966 | |
| S1 | –2.525 | <0.001 | *** | –23.538 | <0.001 | *** | |
| S2 | –1.587 | <0.001 | *** | –24.905 | <0.001 | *** | |
| S3 | –1.831 | <0.001 | *** | –10.817 | 0.248 | ||
| N4 | S1 | –1.403 | <0.001 | *** | –28.096 | <0.001 | *** |
| S2 | –0.464 | 0.567 | –29.463 | <0.001 | *** | ||
| S3 | –0.708 | 0.093 | –15.375 | 0.021 | * | ||
| S1 | S2 | 0.938 | 0.007 | ** | –1.367 | 1.000 | |
| S3 | 0.694 | 0.107 | 12.721 | 0.101 | |||
| S2 | S3 | –0.244 | 0.974 | 14.088 | 0.067 | ||
| ***p-value < 0.001, **p-value < 0.01, *p-value < 0.05; Week = the calendar week when the terminal buds appeared; Br % = the percentage browning of primary needles. | |||||||
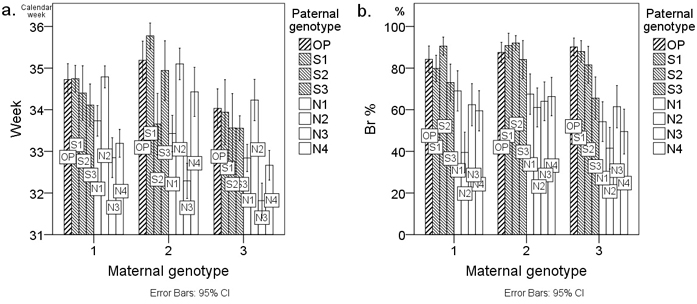
Fig. 1. Average a. timing of budset (Week) and b. frost hardiness (Br %) of first-year Scots pine seedlings from twenty-four cross-combinations presented as bar charts. Cross-combinations (columns) are grouped by the three maternal genotypes M1–M3 on the x-axis. Cross-combinations are labelled with the paternal genotype code. The letters of the paternal genotype codes denote the following: S = southern paternal genotype; N = northern paternal genotype; OP = southern pollen mixture from forests surrounding the orchard of the controlled crosses. Week denotes the calendar week when the terminal buds appeared and Br % denotes the percentage browning of primary needles. Error bars represent the 95% confidence intervals.
| Table 5. Results from the linear regression analyses (Model 2). The analyses quantified the effect of the parental forest locality (Ldd) on the timing of budset (Week) and frost hardening (Br %) of first-year Scots pine seedlings. Model 2: Y = Intercept + Ldd, where Y = Week or Br %; Ldd = average effective temperature sum at the natural forest location. | |||||||
| Dependent variable: Week | Dependent variable: Br % | ||||||
| ANOVA | ANOVA | ||||||
| df | F | p-value | df | F | p-value | ||
| Regression | 1 | 136.104 | <0.001 | Regression | 1 | 140.091 | <0.001 |
| Residual | 42 | Residual | 42 | ||||
| Coefficients | Coefficients | ||||||
| Model | Unstandardized coefficients | Model | Unstandardized coefficients | ||||
| B | SE | p-value | B | SE | p-value | ||
| (Constant) | 28.982 | 0.488 | <0.001 | (Constant) | –103.522 | 13.597 | <0.001 |
| Ldd | 0.0057 | 0.0005 | <0.001 | Ldd | 0.160 | 0.013 | <0.001 |
| df = the number of degrees of freedom; F = F ratio; B = estimate; SE = estimate standard error; Week = the calendar week when the terminal buds appeared; Br % = the percentage browning of primary needles. | |||||||
| Table 6. Results from the ANCOVA tests (Model 3). Model 3 was applied to quantify the effect of the paternal genotype provenance on the timing of budset (Week) and autumn frost hardening (Br %) of controlled-cross Scots pine seedlings. Model 3: Y = Intercept + M + Pdd, where Y = Week or Br %; M = maternal genotype; Pdd = average effective temperature sum at the original location of the paternal genotype, which corresponds to the provenance of the paternal genotype. | |||||||||||||||
| Dependent variable: Week | Dependent variable: Br % | ||||||||||||||
| Tests of between-subject effects | Tests of between-subject effects | ||||||||||||||
| Source | df | F | p-value | Partial Eta Squared | Source | df | F | p-value | Partial Eta Squared | ||||||
| Corrected Model | 3 | 9.868 | <0.001 | 0.270 | Corrected Model | 3 | 28.445 | <0.001 | 0.526 | ||||||
| Intercept | 1 | 4644.29 | <0.001 | 0.983 | Intercept | 1 | 5.529 | 0.021 | 0.067 | ||||||
| Pdd | 1 | 14.498 | <0.001 | 0.153 | Pdd | 1 | 72.706 | <0.001 | 0.486 | ||||||
| Maternal genotype | 2 | 7.553 | 0.001 | 0.159 | Maternal genotype | 2 | 6.598 | 0.002 | 0.146 | ||||||
| Error | 80 | Error | 77 | ||||||||||||
| Parameter estimates | Parameter estimates | ||||||||||||||
| Parameter | B | SE | p-value | Parameter | B | SE | p-value | ||||||||
| Intercept | 31.515 | 0.493 | <0.001 | Intercept | 9.606 | 6.721 | 0.157 | ||||||||
| Pdd | 0.002 | 0.0005 | <0.001 | Pdd | 0.062 | 0.007 | <0.001 | ||||||||
| df = the number of degrees of freedom; F = F ratio; Partial Eta Squared = SSEffect*(SSEffect + SSError)–1, SS = sum of squares; B = coefficient estimate; SE = estimate standard error; Week = the calendar week when the terminal buds appeared; Br % = the percentage browning of primary needles. | |||||||||||||||
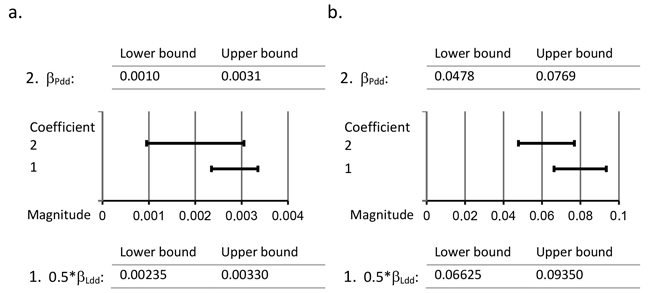
Fig. 2. Comparison of 95% confidence intervals of regression coefficients 0.5*βLdd and βPdd. Detection of the difference in the provenance effect between the Scots pine paternal genotypes of the natural forests and the paternal genotypes of the southern seed orchards by comparing the 95% confidence intervals of 0.5*βLdd and βPdd in the case of a. the timing of budset (Week) and b. frost hardening (Br %) of first-year seedlings. 0.5*βLdd denotes half of the regression coefficient of the independent variable Ldd from Model 2, where Ldd is the average effective temperature sum at the natural forest locality; βPdd denotes the regression coefficient of the covariate Pdd from Model 3, where Pdd is the average effective temperature sum at the original location of the seed orchard paternal genotype.