| Table 1. Characteristics of the sample trees and stands. | |||||||||
| Tree (N=84) | Stand (N=28) | ||||||||
| DBH, cm | H, m | SWD, kg m-3 | SBD, kg m-3 | SD, kg m-3 | Age, years | G, m2 ha-1 | Number of stems per hectare | ||
| Mean | 13.8 | 16.6 | 393 | 446 | 399 | 23 | 16.1 | 1685 | |
| Min | 2.7 | 3.7 | 337 | 373 | 346 | 5 | 0.5 | 420 | |
| Max | 34 | 29.9 | 472 | 570 | 481 | 76 | 45.2 | 3400 | |
| Std | 8.3 | 8.5 | 30.4 | 39.6 | 29.6 | 18.2 | 11.5 | 782 | |
| DBH – diameter at breast height, H – tree height, SWD – stem wood density, SBD – stem bark density, SD – mean stem density, G – stand basal area, Std – standard deviation. | |||||||||
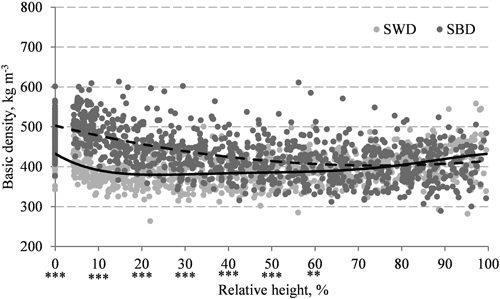
Fig. 1. Mean stem wood density (SWD, solid line) and stem bark density (SBD, dashed line) and their axial variation in European aspen stems. The difference between SWD and SBD was significant at the ***0.001 and **0.01 levels.
| Table 2. Spearman’s correlation coefficients for basic stem density (SD), stem wood density (SWD), stem bark density (SBD) and tree or stand characteristics. Correlations were significant at the ***0.001, **0.01 and *0.05 levels. | |||||||
| Diameter at breast height | Tree height | Number of stems per hectare | Stand basal area | Stand age | Tree relative height | Distance from pith | |
| SD | 0.12 | 0.12 | –0.29** | 0.1 | 0.12 | –0.06 | |
| SWD | 0.12 | 0.12 | –0.28** | 0.1 | 0.12 | 0.05 | 0.15*** |
| SBD | 0.23* | 0.19 | –0.24* | 0.15 | 0.09 | –0.55*** | |
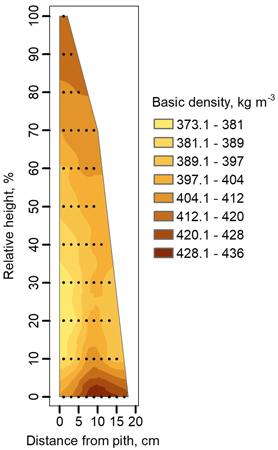
Fig. 2. Basic density variation in stems of European aspen derived from density measurements in wood specimens. A relative height of 0% was defined as 1% of the measured tree height before felling.