| Table 1. Descriptive statistics of nutrient concentrations of solid moose rumen content samples (% DM (dry matter), unless specified) in calibration and prediction sets. | ||||||
| Nutrient | Data set | n | Descriptive statistics | |||
| Minimum | Maximum | Mean | SD | |||
| Crude protein | Calibration | 118 | 8.29 | 25.66 | 13.46 | 3.41 |
| Prediction | 30 | 8.32 | 23.27 | 13.35 | 3.35 | |
| Available protein | Calibration | 118 | 6.17 | 24.19 | 11.49 | 3.41 |
| Prediction | 30 | 6.46 | 22.73 | 11.55 | 3.56 | |
| Microbial-N* | Calibration | 81 | 3.49 | 20.69 | 8.38 | 2.97 |
| Prediction | 21 | 3.87 | 15.97 | 7.93 | 2.71 | |
| Ash | Calibration | 117 | 4.60 | 14.00 | 7.69 | 1.69 |
| Prediction | 30 | 4.65 | 12.36 | 7.73 | 1.76 | |
| NDF** | Calibration | 113 | 35.34 | 69.74 | 56.32 | 6.91 |
| Prediction | 30 | 37.27 | 68.21 | 55.96 | 7.19 | |
| ADF** | Calibration | 111 | 14.10 | 48.14 | 34.54 | 7.30 |
| Prediction | 30 | 15.36 | 47.39 | 34.52 | 7.66 | |
| Lignin | Calibration | 74 | 97.90 | 227.90 | 179.26 | 26.69 |
| Prediction | 21 | 144.50 | 220.10 | 174.59 | 21.82 | |
| n = number of samples. SD = standard deviation. * microbial-N is expressed as mg yeast-RNA g–1 DM. ** NDF and ADF stand for neutral detergent fiber and acid-detergent fiber, respectively. | ||||||
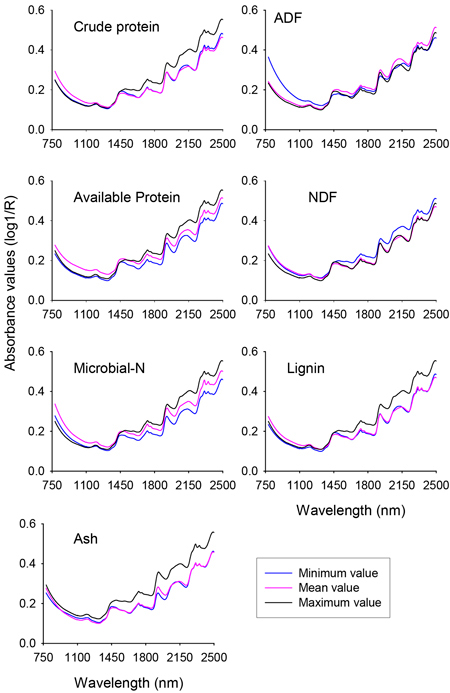
Fig. 1. Profile of NIR spectra for minimum, mean and maximum values of different nutrient concentrations of solid moose rumen contents. ADF and NDF stand for acid-detergent fiber and neutral detergent fiber, respectively.
| Table 2. Statistical summary of models developed to predict nutrient concentrations (% DM (dry matter) unless specified) of solid moose rumen content samples by NIR spectroscopy. | |||||||
| Nutrient | A | R2Xp | R2Xo | R2y | Q2 | RMSEE | RPD |
| Crude protein | 1 + 8 | 0.127 | 0.872 | 0.977 | 0.964 | 0.538 | 5.22 |
| Available protein | 1 + 7 | 0.141 | 0.856 | 0.973 | 0.953 | 0.584 | 4.66 |
| Microbial-N* | 1 + 8 | 0.167 | 0.832 | 0.869 | 0.802 | 1.15 | 2.32 |
| Ash | 1 + 9 | 0.163 | 0.836 | 0.936 | 0.889 | 0.452 | 3.21 |
| NDF** | 1 + 6 | 0.179 | 0.818 | 0.904 | 0.882 | 2.23 | 2.52 |
| ADF** | 1 + 4 | 0.168 | 0.822 | 0.896 | 0.882 | 1.93 | 2.93 |
| Lignin | 1 + 7 | 0.289 | 0.710 | 0.859 | 0.813 | 1.07 | 2.57 |
| A = number of significant components to build the model (the first and second values represent the number of components for predictive and orthogonal variations, respectively). R2Xp = the predictive spectral variation. R2Xo = Y-orthogonal variation (spectral variation uncorrelated to the response). R2y = the modelled variation of nutrient content (the same as the coefficient of determination for cross-validation). Q2 = the predictive power of a model according to cross validation. RMSEE = root mean square error of estimation. RPD = ratio of performance to deviation. * Unit for microbial-N is mg yeast-RNA g–1 DM. ** NDF and ADF stand for neutral detergent fiber and acid-detergent fiber, respectively. | |||||||
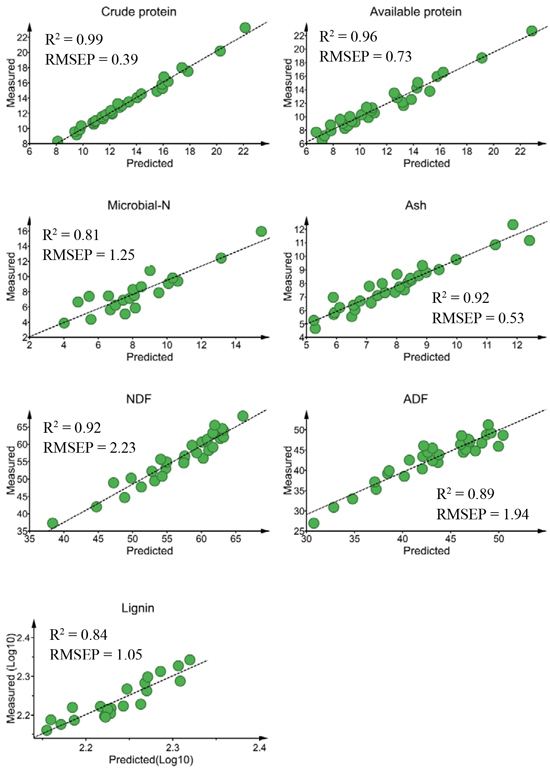
Fig. 2. Relationship between NIR predicted and measured nutrient concentrations of solid moose rumen contents for validation sets. Nutrient concentrations are expressed as % dry matter (DM)for all constituents except microbial-N (mg yeast-RNA g–1 DM). ADF, NDF RMSEP stand for acid-detergent fiber, neutral detergent fiber and root mean square error of prediction, respectively.
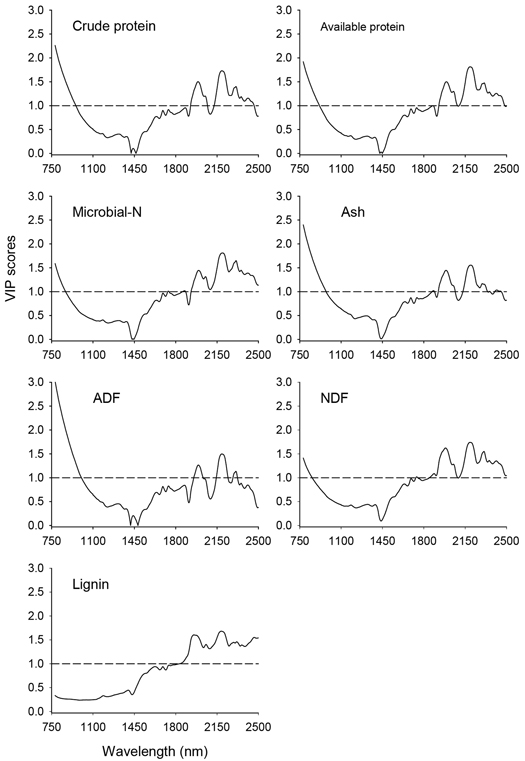
Fig. 3. Variable Influence on Projection (VIP) values depicting absorption bands that were accounted for prediction of nutrient concentrations of solid moose rumen contents. The horizontal dotted line is the cut-off limit for discriminating relevant (VIP > 1.0) and irrelevant predictors. ADF and NDF stand for acid-detergent fiber and neutral detergent fiber, respectively.