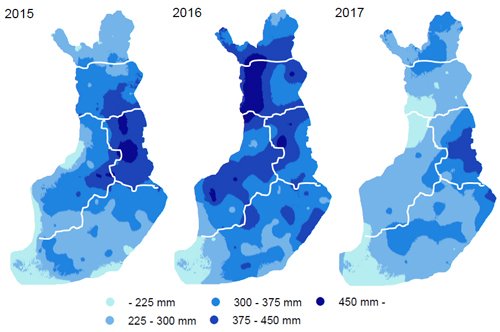
Fig. 1. Cumulative precipitation in Finland from 1 April to 31 August 2015–2017.
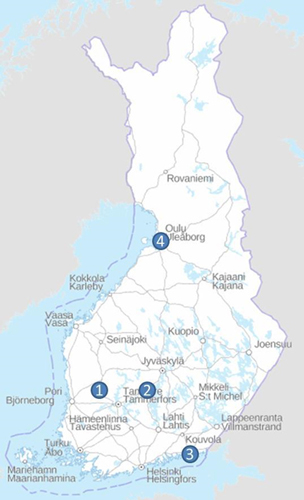
Fig. 2. Location of the validation data sampling points (1 = Hämeenkyrö, 2 = Kaipola, 3 = Kotka and 4 = Oulu).
| Table 1. Harvesting areas in each location classified by the harvesting and forwarding time. | |||||
| Class | Hämeenkyrö | Kaipola | Kotka | Oulu | Total |
| 1 | 6 | 4 | 5 | 3 | 18 |
| 2 | 5 | 4 | 5 | 0 | 14 |
| 3 | 6 | 6 | 4 | 1 | 17 |
| Total | 17 | 14 | 14 | 4 | 49 |
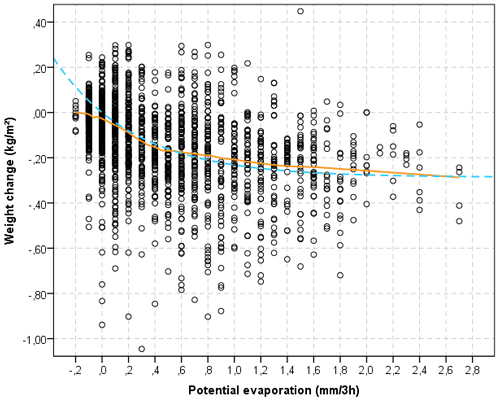
Fig. 3. Relation between the potential evaporation alteration and material weight alteration (Class B and C) (orange, continuous line = LOESS model; blue, dashed line = non-linear model).
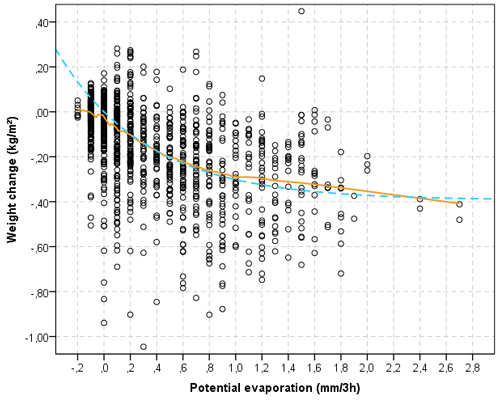
Fig. 4. Relation between the potential evaporation alteration and material weight alteration after rainfall periods (Class B) (orange, continuous line = LOESS model; blue, dashed line = non-linear model).
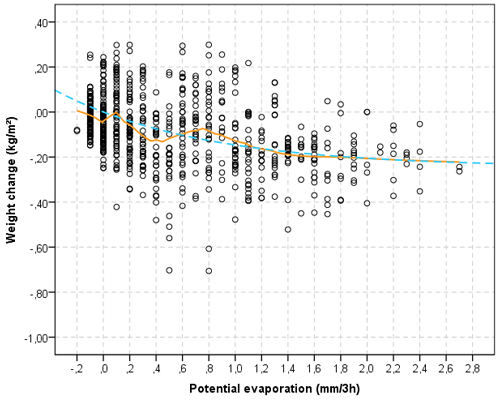
Fig. 5. Relation between the potential evaporation alteration and material weight alteration before rain periods (Class C) (orange, continuous line = LOESS model; blue, dashed line = non-linear model).
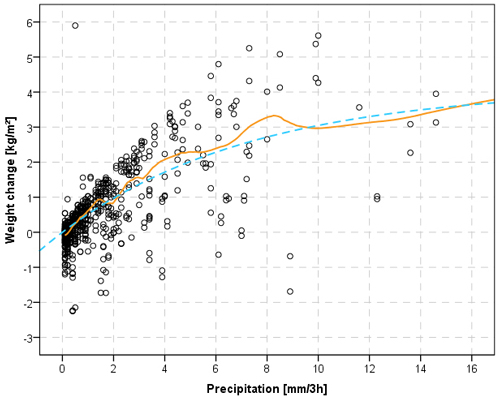
Fig. 6. Relation between the precipitation amount and material weight alteration (Class A) (orange, continuous line = LOESS model; blue, dashed line = non-linear model).
| Table 2. Parameters a11…a22 and b11 …b22 in Eqs. 2–5, Model 1. | ||||
| Eq. | b11 | b12 | b21 | b22 |
| 2 | 0.01 | 1.90 | ||
| 3 | 4.10 | –7.40 | ||
| Eq. | a11 | a12 | a21 | a22 |
| 4 | –0.04 | –0.20 | ||
| 5 | 0.30 | –0.70 | ||
| Table 3. Moisture content of fresh logging residues depending on the harvesting month in Finland. | ||||||||||||
| Moisture content of fresh harvesting residues, monthly, % | ||||||||||||
| Jan | Feb | Mar | Apr | May | Jun | Jul | Aug | Sep | Oct | Nov | Dec | |
| Pine | 55 | 55 | 55 | 54 | 54 | 54 | 54 | 53 | 54 | 54 | 55 | 54 |
| Spruce | 52 | 52 | 51 | 51 | 50 | 50 | 50 | 50 | 51 | 51 | 51 | 52 |
| Table 4. Green density factors for logging residues in Southern Finland and Ostrobothnia (Luonnonvarakeskuksen määräys 1/2017). | ||||||
| Weight class | Moisture content | Time period | Green density factor | |||
| % | 1/4–30/4 | 1/5–15/8 | 16/8–30/9 | 1/10–31/3 | kg m–3 | |
| 1 | > 50 | Non-seasoned or wet residues, with snow and ice | 950 | |||
| 2 | 45–50 | fresh, 20 days ↓ | fresh, 10 days ↓ | fresh, 20 days ↓ | fresh | 840 |
| 3 | 40–44 | ≥ 20 days | → 15 days ↓ | ≥ 20 days | ≥ 20 days | 770 |
| 4 | 35–39 | - | 20 days ↓ | 20 days ↑ | 20 days ↑ | 700 |
| 5 | 30–34 | - | 35 days ↓ | 20 days ↑ | - | 650 |
| 6 | < 30 | - | ≥ 80 days | 20 days ↑ | - | 600 |
| Table 5. Green density factors for logging residues in Kainuu, Lapland and Northern Lapland (Luonnonvarakeskuksen määräys 1/2017). | ||||||
| Weight class | Moisture content | Time period | Green density factor | |||
| % | 16/4–15/5 | 16/5–31/7 | 1/8–15/9 | 16/9–15/4 | kg m–3 | |
| 1 | > 50 | Non-seasoned or wet residues, with snow and ice | 950 | |||
| 2 | 45–50 | fresh, 20 days ↓ | fresh, 15 days ↓ | fresh, 20 days ↓ | fresh | 840 |
| 3 | 40–44 | ≥ 20 days | → 20 days ↓ | ≥ 20 days | ≥ 20 days | 770 |
| 4 | 35–39 | - | 30 days ↓ | 20 days ↑ | 20 days ↑ | 700 |
| 5 | < 35 | - | ≥ 65 days | 20 days ↑ | - | 650 |
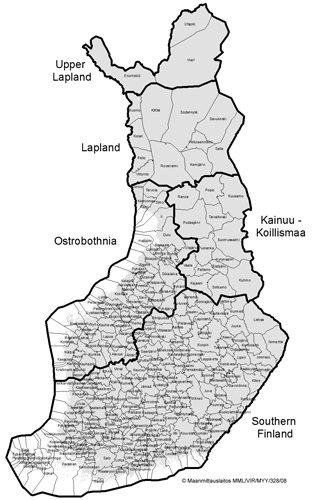
Fig. 7. Geographical region allocation of green density factors (Luonnonvarakeskuksen määräys 1/2017).
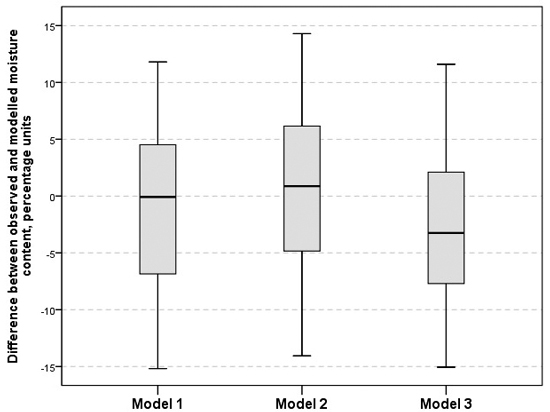
Fig. 8. Difference between observed and modelled moisture content for Models 1–3.
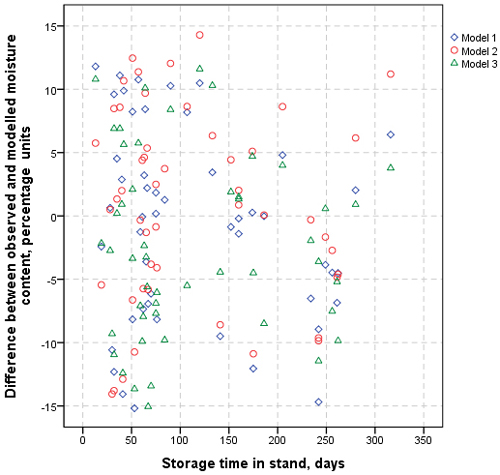
Fig. 9. Difference between the observed and modelled moisture for individual harvesting sites in relation to the storage time.
| Table 6. Accuracy of the models by harvesting sites class. Number and percentage of the sites where the estimated moisture content was within the targeted ±5% accuracy range. | ||||
| Harvesting Class | Number of Sites | Model 1 | Model 2 | Model 3 |
| 1 | 18 | 11 (61%) | 9 (50%) | 12 (67%) |
| 2 | 14 | 8 (57%) | 7 (50%) | 4 (29%) |
| 3 | 17 | 4 (24%) | 5 (29%) | 4 (24%) |
| Total | 49 | 23 (47%) | 21 (43%) | 20 (41%) |