| Table 1. Effect of genotype and collection date on the in vitro establishment of shoot cultures of several adult clones of Alnus glutinosa. | ||||||||
| Clone | Flushing capacity (%) | Number of initial explants | Contamination rate (%) | Period needed for stabilization (months) | ||||
| June | November | June | November | June | November | June | November | |
| R1 | 15.0 | 66.7 | 22.0 | 25.0 | 9.1 | 56.0 | 12 | 12 |
| R2 | 44.4 | - | 24.0 | - | 25.0 | - | 10 | - |
| R3 | 33.3 | 77.8 | 20.0 | 21.0 | 10.0 | 57.1 | Lost | 10 |
| R4 | 43.8 | 60.0 | 21.0 | 20.0 | 23.8 | 50.0 | Lost | 10 |
| G1 | 94.1 | - | 40.0 | - | 15.0 | - | 5 | - |
| Table 2. Effect of zeatin regime on the in vitro multiplication of Alnus glutinosa (genotype R4). Data were collected at the end of a 9-week multiplication period. | |||||
| Treatment | Response (%) | No. of shoots 0.5–1.0 cm 2) | No. of shoots ≥ 1.0 cm 2) | Total no. of shoots 2) | Longest shoot length (mm) 2) |
| Control | 92.6±1.83 | 1.0±0.41a | 0.9±0.09a | 2.0±0.35a | 14.9±0.38a |
| Regime 1 1) | 96.3±3.70 | 2.1±0.17b | 1.0±0.11a | 3.1±0.15b | 15.0±0.79a |
| Regime 2 | 100.0±0.00 | 1.5±0.18a | 1.3±0.16b | 2.8±0.21c | 16.5±0.79b |
| 1) Regime 1: Cycle 1: 0.88 µM BA + 2.85 µM IAA, cycle 2: 0.44 µM BA + 2.85 µM IAA, cycle 3: 0.44 µM BA + 2.85 µM IAA + 2.28 µM zeatin. Regime 2: as regime 1 with 2.28 µM zeatin in all cycles. Control without zeatin. Values represent means ± SE for three replications. 2) In each column, values followed by the same letter are not significant at p ≤ 0.05 level using Student’s test | |||||
| Table 3. Effect of carbohydrate source (S: sucrose, G: glucose) on the in vitro multiplication of Alnus glutinosa (Genotypes G1 and R4). Data were collected after 9-week multiplication period. | ||||||||||||||
| Sugar (%) | Response (%) 1) | No of shoots 0.5–1 cm | No of shoots ≥ 1 cm 2) | Total no of shoots 2) | Shoot length (mm) 2) | |||||||||
| S | G | S | G | S | G | S | G | S | G | |||||
| G1 | ||||||||||||||
| 2% | 92.4±0.9 | 100±0.0 | 0.5±0.02 | 0.8±0.02 | 1.1±0.02 | 2.2±0.08 | 1.7±0.02 | 3.1±0.08 | 16.8±0.11 | 23.0±0.44 | ||||
| 3% | 100±0.0 | 100±0.0 | 0.7±0.03 | 1.1±0.07 | 1.2±0.01 | 2.3±0.08 | 1.9±0.02 | 3.5±0.13 | 17.2±0.37 | 22.4±0.33 | ||||
| Mean | 1.2±0.06a | 2.3±0.03b | 1.8±0.1a | 3.3±0.2b | 17.0±0.2a | 22.7±0.3b | ||||||||
| R4 | ||||||||||||||
| G 2% | 98.0±0.5 | 1.4±0.11 | 2.4±0.04a | 3.8±0.08a | 18.0±0.11a | |||||||||
| S 3% | 98.1±0.4 | 0.7±0.03 | 1.4±0.05b | 2.1±0.08b | 16.3±0.20b | |||||||||
| 1) Percentage of explants that forming shoots. Values represent means ± SE for three replications. 2) In each column, values followed by the same letter are not significantly different at the P ≤ 0.05 level, according to the Least Significant Difference (LSD) test. | ||||||||||||||

Fig. 1. Micropropagation by axillary shoot proliferation of Alnus glutinosa. A. Forced flushing of branch sections in the growth chamber. B. Shoot multiplication in genotype G1 after culture in WPM medium (Regime 1) supplemented with glucose 2%. C. Root development on shoots of genotype R4 treated with 0.49 µM IBA and glucose 2%. D. Acclimatized plants (genotype R4) 6 weeks old.
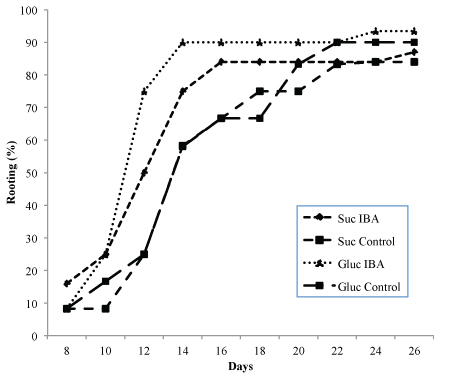
Fig. 2. Rooting ability of Alnus glutinosa shoots (Genotype G1) relative to incubation time. Shoots were incubated in rooting medium with or without 0.49 µM IBA and glucose 2% or sucrose 3% as carbohydrate source.
| Table 4. Effect of carbohydrate source and auxin (0.49 µM IBA) on root formation in shoots from Alnus glutinosa (Genotypes G1 and R4). Data were collected after 4 weeks. | ||||||
| Rooting treatment | Rooting (%) | Number of roots 1) | Length of longest root (mm) 1) | |||
| Sucrose 3% | Glucose 2% | Sucrose 3% | Glucose 2% | Sucrose 3% | Glucose 2% | |
| G1 | ||||||
| –IBA | 84.0±8.0 | 90.0±10.0 | 2.1±0.1a | 2.1±0.1a | 28.2±0.5 | 30.3±4.5 |
| +IBA | 86.9±2.5 | 93.4±6.7 | 2.3±0.1b | 2.0±0.1a | 29.5±1.4 | 32.3±0.3 |
| Mean | 28.9±0.6a | 31.3±1.0b | ||||
| R4 | ||||||
| –IBA | 79.0±2.4 | 79.3±0.7 | 2.5±0.2 | 2.1±0.2 | 32.4±5.0 | 29.7±0.6 |
| +IBA | 79.4±2.4 | 85.7±1.1 | 2.6±0.4 | 2.1±0.1 | 34.1±5.0 | 29.2±1.4 |
| Mean | 2.3±0.0a | 2.1±0.0b | ||||
| Values represent means ± SE for three replicates. 1) In each column, values followed by the same letter are not significantly different at the P ≤ 0.05 level, according to the Least Significant Difference (LSD) test. | ||||||