| Table 1. Temperature (threshold > +5 °C) and rainfall sums during May to September in the study years 2007 to 2011 in Suonenjoki, central Finland (Venäläinen et al 2005). |
| Suonenjoki | Temperature, dd °C | Rainfall, mm |
| 2007 | 1220 | 372 |
| 2008 | 994 | 357 |
| 2009 | 1257 | 225 |
| 2010 | 1427 | 245 |
| 2011 | 1423 | 408 |
| 1970–2010 | 1167 | 297 |
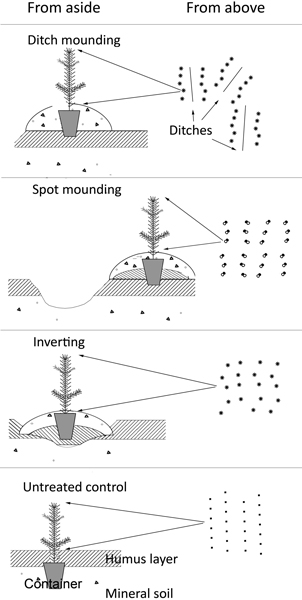
Fig. 1. Schematic illustration for the treatments of ditch and spot mounding, inverting and untreated control.
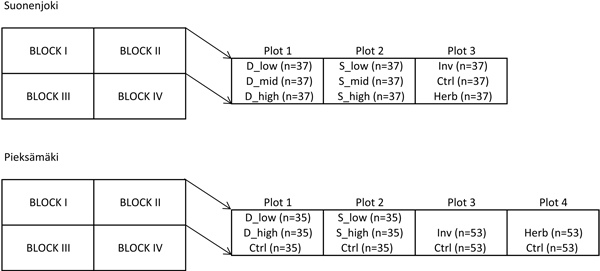
Fig. 2. Schematic graph of the experimental design. For treatment abbreviations, see text or legend for Table 3 (n refers to the number of planted seedlings).
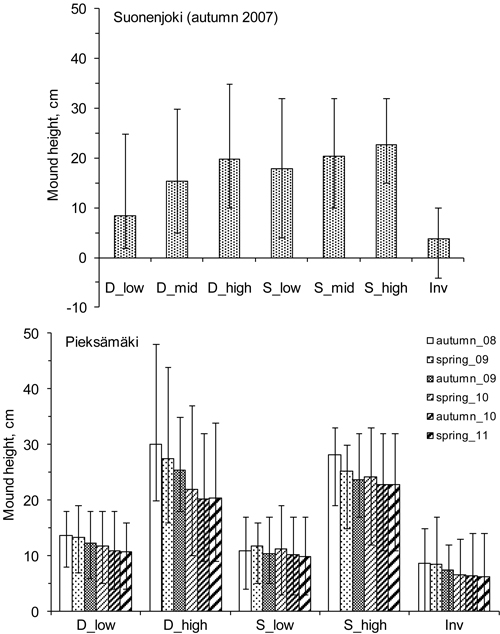
Fig. 3. Arithmetic means for the mound heights in the different mounding treatments in Suonenjoki (measured only after the first growing season) and Pieksämäki (n = 15–20). Vertical lines on bars show the range of variation (i.e. max-min). For treatment abbreviations, see text or legend for Table 3.
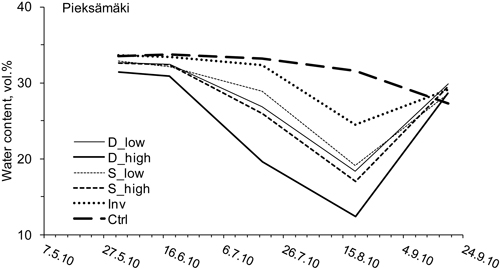
Fig. 4. Example of the mean course of soil water content during the dryish summer of 2010 in Pieksämäki (n = 16). For treatment abbreviations, see text or legend for Table 3. Date presented as day/month/year.
| Table 2. Temperature sums (threshold > +5 °C) for the soil preparation treatments in 2009 (29th April to 30th September) in Suonenjoki and Pieksämäki (one sensor in each treatment). The numbers within brackets indicates the distance in cm from the soil surface. Treatment abbreviations: Ctrl – untreated soil, Inv – inverting, S_low, S_mid – low or mid height spot mounding and D_low – low ditch mounding. |
| Suonenjoki | dd, °C | Pieksämäki | dd, °C |
| Air (+15 cm) | 1284 | Air (+15 cm) | 1169 |
| Ctrl (–11 cm) | 1062 | Ctrl (–12 cm) | 807 |
| Inv (–5 cm) | 1322 | Inv (–6 cm) | 1238 |
| S_mid (–5 cm) | 1446 | S_low (–6 cm) | 1282 |
| S_mid (–8 cm) | 1463 | D_low (–6 cm) | 1186 |
| Table 3. Soil water content (vol.%) in the different soil preparation treatments in Suonenjoki and in Pieksämäki. Estimated marginal means denoted by the same letter within years show non-significant differences according to LSD pairwise comparisons at p > 0.05. p-value shows the significance of the difference in means within sites and years (F-test, block means as observations i.e. n = 4). Treatment abbreviations: Ctrl – untreated soil, Inv – inverting, S_low, S_mid, S_high – low, mid or high height spot mounding and D_low, D_mid, D_high – low, mid or high height ditch mounding. |
| Suonenjoki |
| Treatment | 2007 | 2008 | 2009 |
| D_low | 20.4 a | 17.2 a | 21.9 a |
| D_mid | 20.4 a | 20.6 b | 23.1 ab |
| D_high | 21.1 a | 22.4 b | 23.7 ab |
| S_low | 23.3 a | 22.6 b | 24.3 b |
| S_mid | 23.8 a | 22.7 b | 22.5 a |
| S_high | 22.8 a | 22.0 b | 23.5 ab |
| Inv | 29.1 b | 28.4 c | 27.7 c |
| Ctrl | 31.4 b | 29.3 c | 29.6 c |
| p | <0.0005 | <0.0005 | <0.0005 |
| Pieksämäki |
| Treatment | 2009 | 2010 | 2011 |
| D_low | 30.5 ab | 27.7 ab | 31.3 abc |
| D_high | 28.4 a | 24.3 a | 27.9 a |
| S_low | 32.2 bcd | 28.2 ab | 31.7 bc |
| S_high | 30.7 abc | 27.4 ab | 30.5 ab |
| Inv | 33.0 cd | 30.6 bc | 32.9 bc |
| Ctrl | 33.3 d | 31.8 c | 33.4 c |
| p | <0.0005 | <0.0005 | <0.0005 |
| Table 4. Current-year foliar nutrients of vigorous seedlings in the different soil preparation treatments after the second growing season 2008 in Suonenjoki and 2010 in Pieksämäki. Estimated marginal means denoted by the same letter show non-significant differences according to LSD pairwise comparisons at p > 0.05 (n = 4 within treatments). p-value shows the significance of the difference in means (F-test). For treatment abbreviations, see text or legend for Table 3. |
| Treatment | N, % | P, mg kg–1 | Ca, mg kg–1 | Al, mg kg–1 | Fe, mg kg–1 | B mg kg–1 |
| Suonenjoki 2008 |
| D_low | 2.5 abc | 1990 a | 3995 a | 116 bc | 61 b | 6.7 a |
| D_mid | 2.4 ab | 1975 a | 3500 b | 138 ab | 82 a | 5.0 b |
| D_high | 2.4 ab | 1958 ab | 3540 b | 148 a | 82 a | 5.0 b |
| S_low | 2.7 cd | 1748 d | 2778 c | 92 c | 54 bcd | 6.0 ab |
| S_mid | 2.5 ab | 1828 cd | 2773 c | 114 bc | 56 bcd | 5.3 ab |
| S_high | 2.6 bcd | 1840 bcd | 2430 d | 144 a | 49 abc | 5.1 b |
| Inv | 2.4 a | 1913 abc | 2638 cd | 157 a | 44 bcd | 5.7 ab |
| Herb | 2.7 d | 1798 d | 3370 b | 47 d | 34 d | 6.4 ab |
| Ctrl | 2.5 ab | 1815 cd | 3295 b | 45 d | 38 cd | 6.4 ab |
| p | 0.007 | 0.016 | <0.0005 | <0.0005 | 0.010 | 0.078 |
| Pieksämäki 2010 |
| D_low | 2.0 abc | 1756 ab | 4636 ab | 119 a | 44 a | 9.0 ab |
| D_high | 2.1 abc | 1794 ab | 5043 b | 145 a | 68 a | 6.3 a |
| S_low | 1.9 ab | 1742 a | 3336 a | 105 a | 43 a | 12.3 b |
| S_high | 2.3 bc | 1792 ab | 3571 ab | 140 a | 61 a | 9.5 ab |
| Inv | 1.8 ab | 1683 a | 3351 a | 115 a | 41 a | 8.0 ab |
| Herb | 2.4 c | 2084 b | 3949 ab | 40 b | 92 a | 9.7 ab |
| Ctrl | 1.8 a | 1901 ab | 3444 a | 32 b | 36 a | 9.9 ab |
| p | <0.0005 | 0.012 | 0.002 | <0.0005 | 0.153 | 0.023 |
| Table 5. Percentage of seedlings gnawed by pine weevil and voles and heaved by frost in Suonenjoki and Pieksämäki. Arithmetic means denoted by the same letter show non-significant differences within years according to LSD pairwise comparisons at p > 0.05 (n = 4 i.e. block means as observations). p-value shows the significance of the difference in means (F-test). For treatment abbreviations, see text or legend for Table 3. |
| Treatment | Frost heave | Frost heave | Vole | Pine weevil | Pine weevil |
| Suonenjoki | 2008 spring | 2009 spring | 2009 spring | 2007 autumn | 2008 autumn |
| D_low | 16.9 ab | 19.7 ab | 62.0 a | 1.1 a | 5.3 a |
| D_mid | 18.1 ab | 23.3 ab | 56.5 ab | 0.5 a | 6.7 a |
| D_high | 12.5 abc | 17.0 abc | 52.0 b | 0.0 a | 7.8 a |
| S_low | 1.8 bcd | 3.7 bcd | 81.8 d | 0.5 a | 10.4 a |
| S_mid | 4.8 abd | 9.1 abcd | 78.8 cd | 0.0 a | 7.3 a |
| S_high | 2.7 abd | 10.9 abcd | 77.8 cd | 0.0 a | 7.9 a |
| Inv | 18.4 a | 18.5 a | 73.4 a | 0.0 a | 11.8 a |
| Herb | 0.0 cd | 0.0 cd | 79.0 cd | 37.7 b | 15.4 a |
| Ctrl | 0.0 d | 0.0 d | 72.5 ac | 31.0 b | 10.4 a |
| p | 0.001 | 0.001 | <0.0005 | <0.0005 | 0.648 |
| Pieksämäki | 2010 spring | 2011 spring | 2009 autumn | 2009 autumn | 2010 autumn |
| D_low | 4.0 ab | 0.8 ab | 2.9 a | 7.1 a | 1.6 abc |
| D_high | 1.7 bc | 0.8 ab | 0.7 a | 2.9 a | 2.5 abc |
| S_low | 5.7 ab | 2.4 ab | 0.0 a | 7.9 a | 4.8 b |
| S_high | 2.4 abc | 1.6 ab | 0.0 a | 5.0 a | 0.0 c |
| Inv | 5.7 a | 3.1 a | 0.5 a | 8.0 a | 3.6 abc |
| Herb | 0.0 c | 0.0 b | 2.8 a | 67.2 b | 33.4 d |
| Ctrl | 0.1 c | 0.0 b | 1.6 a | 55.6 b | 13.0 b |
| p | 0.016 | 0.206 | 0.603 | <0.0005 | 0.001 |
| Table 6. Percentage of mortality and vigorous seedlings (class 1 and 2) in different years in Suonenjoki and Pieksämäki. Seedlings that died in previous years are not counted in the values for the current year. Arithmetic means denoted by the same letter show non-significant differences within years according to LSD pairwise comparisons at p > 0.05. p-value shows the significance of the difference in means (F-test). For treatment abbreviations, see text or legend for Table 3. |
| Treatment | Mortality | Vigorous seedlings |
| Suonenjoki | 2007 | 2008 | 2009 | 2010 | 2007 | 2008 | 2009 | 2010 |
| D_low | 0.6 a | 0.0 | 4.1 ab | 1.8 a | 96.8 a | 98.3 a | 66.5 ab | 82.5 a |
| D_mid | 2.1 a | 0.0 | 2.4 a | 1.8 a | 97.9 a | 98.3 a | 70.3 ab | 79.0 ab |
| D_high | 0.6 a | 0.0 | 4.1 a | 1.3 a | 98.9 a | 98.3 a | 80.3 c | 84.0 a |
| S_low | 0.0 a | 0.0 | 4.8 ab | 1.3 a | 98.9 a | 98.8 a | 64.0 ab | 79.8 a |
| S_mid | 0.0 a | 0.0 | 2.9 a | 1.8 a | 99.5 a | 97.8 a | 64.0 ab | 70.5 b |
| S_high | 0.0 a | 0.0 | 3.9 | 3.0 a | 99.5 a | 100.0 a | 66.5 abc | 75.5 ab |
| Inv | 1.0 a | 0.0 | 4.9 abc | 2.8 a | 98.5 a | 93.3 a | 63.0 b | 62.3 c |
| Herb | 19.2 b | 0.0 | 11.6 bc | 2.1 a | 71.1 b | 97.8 a | 48.8 a | 66.5 bc |
| Ctrl | 27.5 c | 0.0 | 11.1 c | 0.8 a | 63.9 b | 96.5 a | 59.3 ab | 66.3 bc |
| p | <0.0005 | - | 0.047 | 0.781 | <0.0005 | 0.428 | 0.041 | 0.037 |
| Pieksämäki | 2009 | 2010 | 2011 | | 2009 | 2010 | 2011 | |
| D_low | 1.4 a | 0.8 a | 0.8 ab | | 90.8 a | 89.4 ab | 95.9 ab | |
| D_high | 0.7 a | 2.5 a | 0.0 a | | 95.0 a | 92.7 ab | 96.7 a | |
| S_low | 0.7 a | 4.8 a | 0.8 a | | 97.8 a | 89.4 bc | 96.0 abc | |
| S_high | 0.7 a | 0.0 a | 0.0 a | | 99.3 a | 97.6 a | 98.4 ab | |
| Inv | 0.5 a | 2.1 a | 0.5 a | | 89.6 a | 81.4 bc | 84.8 bcd | |
| Herb | 13.3 b | 20.1 b | 2.6 ab | | 64.5 b | 48.4 d | 74.0 d | |
| Ctrl | 8.5 b | 7.2 a | 6.3 b | | 75.9 b | 71.3 cd | 85.3 cd | |
| p | 0.002 | 0.010 | 0.065 | | <0.0005 | <0.0005 | 0.009 | |
| Table 7. Seedling height (cm) development in the different soil preparation treatments in Suonenjoki and in Pieksämäki. Estimated marginal means denoted by the same letter show non-significant differences according to LSD pairwise comparisons at p > 0.05. p-value shows the significance of the difference in means (F-test). In each treatment within each of the four blocks initial n = 47 in Suonenjoki and = 35 or 53 in Pieksämäki. Pairwise comparisons for the mainplot treatments (D, S, Inv, Herb, Ctrl) are deriving from contrast tests. For treatment abbreviations, see text or legend for Table 3. |
| Treatment | 2007 Planting | 2007 | 2008 | 2009 | 2010 |
| Suonenjoki |
| D_low | 23.4 a | 27.2 a | 40.8 abc | 47.1 ab | 67.8 abc |
| D_mid | 23.2 a | 27.7 abc | 40.0 ab | 46.3 b | 67.5 abc |
| D_high | 22.9 a | 27.6 ab | 39.8 a | 49.4 a | 70.7 a |
| S_low | 22.9 a | 28.4 bcd | 43.0 c | 45.5 ab | 66.5 ab |
| S_mid | 22.8 a | 28.7 de | 42.2 bc | 42.9 b | 61.7 c |
| S_high | 22.7 a | 28.9 de | 42.5 c | 45.1 ab | 64.5 abc |
| Inv | 22.5 a | 29.6 e | 41.0 abc | 44.1 ab | 60.2 c |
| Herb | 22.7 a | 28.5 cd | 42.2 abc | 43.4 ab | 61.6 c |
| Ctrl | 22.7 a | 28.8 d | 42.2 abc | 44.0 ab | 60.9 c |
| p | 0.712 | 0.003 | 0.083 | 0.278 | 0.138 |
| D | 23.2 a | 27.5 a | 40.2 a | 47.6 a | 68.6 a |
| S | 22.8 a | 28.7 b | 42.6 b | 44.5 a | 64.2 ab |
| Inv | 22.5 a | 29.6 c | 41.0 ab | 44.1 a | 60.2 b |
| Herb | 22.7 a | 28.5 b | 42.2 ab | 43.4 a | 61.6 ab |
| Ctrl | 22.7 a | 28.8 b | 42.2 ab | 44.0 a | 60.9 ab |
| p | 0.633 | 0.002 | 0.065 | 0.628 | 0.285 |
| Pieksämäki | 2009 Planting | 2009 | 2010 | 2011 | |
| D_low | 19.6 ab | 24.6 ab | 33.3 ab | 50.2 ab | |
| D_high | 19.7 ab | 24.9 ab | 34.3 ab | 51.5 a | |
| S_low | 20.1 a | 25.4 a | 34.5 ab | 49.2 abc | |
| S_high | 19.9 ab | 24.7 ab | 35.3 a | 51.5 a | |
| Inv | 19.3 b | 25.4 a | 34.1 ab | 47.4 b | |
| Herb | 20.0 ab | 22.8 c | 31.8 b | 45.7 c | |
| Ctrl | 19.9 a | 24.1 b | 32.8 b | 48.2 b | |
| p | 0.32 | 0.001 | 0.070 | 0.057 | |
| D | 19.6 ab | 24.7 ab | 33.8 ab | 50.8 a | |
| S | 20.0 a | 25.1 b | 34.9 b | 50.4 a | |
| Inv | 19.3 b | 25.4 b | 34.1 ab | 47.4 ab | |
| Herb | 20.0 ab | 22.8 c | 31.8 a | 45.7 b | |
| Ctrl | 19.9 a | 24.1 a | 32.8 a | 48.2 ab | |
| p | 0.181 | 0.001 | 0.039 | 0.047 | |