| Table 1. Stand characteristics at plot establishment. | |||
| Treatment | Standing volume a) (m3 ha–1) | Stem number a) (stems ha–1) | Basal area a) (m2 ha–1) |
| 1 Clear-cutting and planting | 202 | 1162 | 27.0 |
| 2 Seed tree regeneration | 204 | 1100 | 26.6 |
| 3 Selection system | 180 | 1526 | 25.8 |
| 4 Diameter limit harvest | 200 | 784 | 22.9 b) |
| 5 Control | 174 | 1815 | 25.1 |
| a) Only trees with dbh ≥ 4.5 cm included b) Only trees with dbh ≥ 10 cm included | |||
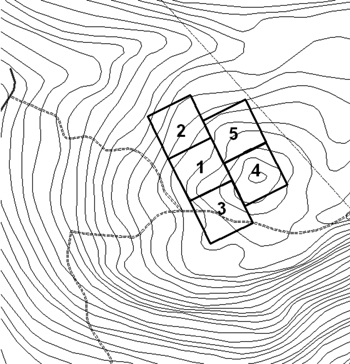
Fig. 1. Map over the experimental area. Equidistance 5 m.
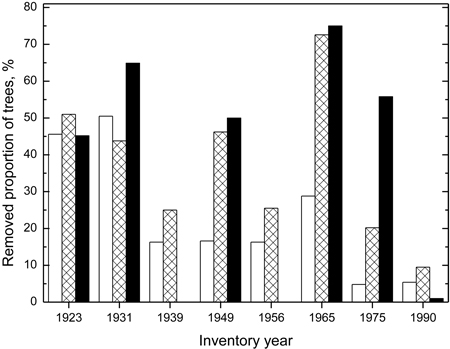
Fig. 2. Percentage of trees harvested in treatment Selection, in three relative diameter classes at each cutting, representing the lower (open), middle (hatched) and upper (filled) third of the dbh range 8.5 cm – current maximum dbh.
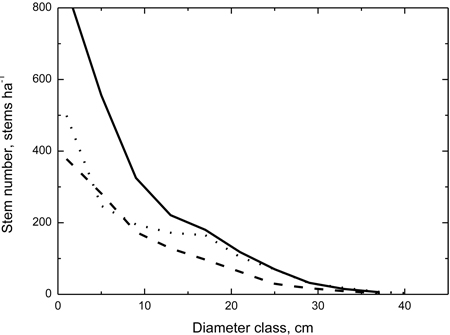
Fig. 3. Diameter distribution for the treatment Selection before (dotted line) and after (dashed line) the initial harvest in 1923, and before harvest in 2006 (solid line).
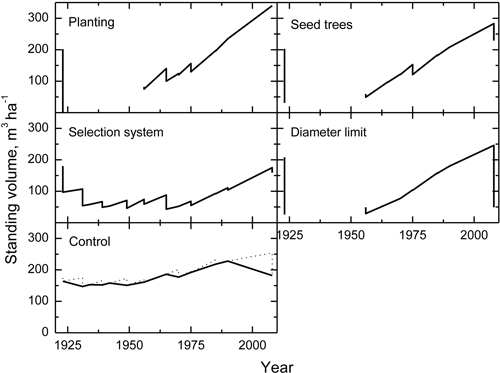
Fig. 4. Development of standing volume during the period 1923 to 2008 for all treatments. The dotted line for the control shows volume including dead trees. For plots Planting, Seed trees, and Diameter limit, only harvested trees were recorded during the first decades. After the initial harvest, standing volume was not recorded until 1956.
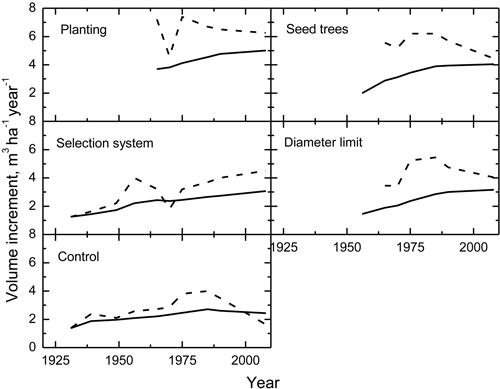
Fig. 5. Periodic (PAI, dashed line) and mean (MAI, solid line) annual volume increment for all treatments from 1923 until the final measurement in 2006–2008 (see Material and methods for details). For plots Planting, Seed trees, and Diameter limit, volume increment could not be calculated until after 1956, because only harvested trees were recorded during the first decades and not the standing volume.
| Table 2. Mean volume of trees harvested and lost through self thinning. | |
| Treatment | Stem volume, m3 tree–1 |
| 1 Clear-cutting and planting | 0.17 |
| 2 Seed tree regeneration | 0.20 |
| 3 Selection system | 0.17 |
| 4 Diameter limit harvest | 0.18 |
| 5 Control | 0.13 |
| a) In treatments 1–4 most self-thinned trees were extracted and treated as trees harvested, whereas treatment 5 only has self-thinning. | |