| Table 1. Machine concept chipper truck and its attributes. |
| Chipper [ ] | Jenz HEM 561 R |
| Type [ ] | MAN TGA 28.480 6x4-4BL |
| Drum [mm] | 820 |
| Blades [n] | 10/20 |
| Drive [ ] | MAN chassis |
| Engine power [kw] | 353 |
| Loading unit [ ] | Epsilon E110L Plus |
| Weight [t] | 20 |
| Discharge [ ] | Blowing unit |
| Year | 2007 |
 |
| Table 2. Transporting vehicle attributes. |
| Code | Type of engine and chassis | Year of construction |
| 184-1 | Mercedes Benz Actros 2640 L 6x4 | 2000 |
| 214-2 | MAN 27364 DFC T48 6x4 | 2000 |
| 734-4 | Mercedes Benz Actros 2640 6x4 | 1998 |
| 728-3 | MAN TGA 33.4440 BB H 35 6x4 | 2007 |
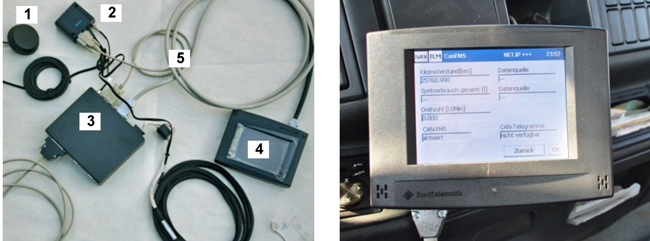
Fig. 1. Fleet management equipment with the components that were used during the project.
| Table 3. Average load data [green-tons] of participating trucks during the study period. |
| Vehicle ID | Mean | Maximum | Minimum | 5th percentile | 95th percentile | [n] |
| 184-1 | 22.5 | 28.9 | 10.4 | 17.0 | 27.1 | 101 |
| 214-2 | 23.0 | 26.9 | 14.1 | 19.2 | 25.5 | 77 |
| 728-3 | 22.3 | 28.7 | 14.7 | 16.5 | 27.5 | 79 |
| 734-4 | 22.1 | 27.4 | 8.4 | 18.2 | 25.5 | 179 |
| Sum | 22.4 | 28.9 | 8.4 | 17.2 | 26.2 | 436 |
| Table 4. Average load data [odt] of the participating trucks during the study period. |
| Vehicle ID | Mean | Maximum | Minimum | 5th percentile | 95th percentile | [n] |
| 184-1 | 14.3 | 18.1 | 7.1 | 10.4 | 17.2 | 101 |
| 214-2 | 14.1 | 17.8 | 8.3 | 10.3 | 17.4 | 77 |
| 728-3 | 13.9 | 18.2 | 9.0 | 10.2 | 16.9 | 79 |
| 734-4 | 13.7 | 19.2 | 5.3 | 9.5 | 16.7 | 179 |
| Sum | 13.9 | 19.2 | 5.3 | 10.2 | 17.2 | 436 |
| Table 5. Time consumption [min] of the recorded processes for transport based on recorded and dispatched delivery notes. |
| Process | Mean | Maximum | Minimum | 5th percentile | 95th percentile | [n] |
| Driving empty | 75.0 | 118.2 | 20.4 | 48.6 | 105.0 | 42 |
| Loading | 70.8 | 118.2 | 42.6 | 48.0 | 116.4 | 46 |
| Driving loaded | 81.0 | 159.6 | 46.8 | 56.4 | 137.4 | 43 |
| Scaling/Unloading | 25.2 | 51.6 | 12.6 | 13.2 | 48.0 | 40 |
| Other delays | 6.0 | 13.8 | 0.0 | 0.0 | 13.8 | 6 |
| Waiting delays | 24.6 | 69.6 | 3.6 | 3.6 | 69.6 | 12 |
| Others | 4.2 | 11.4 | 0.0 | 0.0 | 11.4 | 22 |
| Table 6. Time consumption [min] for scaling and unloading activities at the plant for participating trucks during the study period. |
| Vehicle ID | Mean | Maximum | Minimum | 5th percentile | 95th percentile | [n] |
| 184-1 | 37.6 | 93.0 | 12.0 | 14.0 | 77.0 | 85 |
| 214-2 | 34.0 | 67.0 | 12.0 | 14.0 | 56.0 | 67 |
| 728-3 | 32.9 | 97.0 | 12.0 | 14.0 | 64.0 | 73 |
| 734-4 | 39.3 | 95.0 | 12.0 | 15.0 | 69.0 | 146 |
| Sum | 36.7 | 97.0 | 12.0 | 14.0 | 67.0 | 371 |
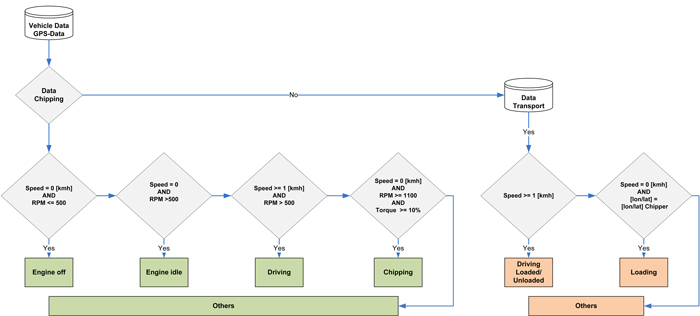
| Table 7. Process time with a running engine during the study period based on automatically assigned processes. |
| Process with running engine | Sum [h] 15 Months | Sum [h] 12 Months | [%] |
| Chipping | 1203.0 | 962.4 | 48.6 |
| Driving | 585.8 | 468.7 | 23.7 |
| Idle running | 608.4 | 486.7 | 24.6 |
| Others | 79.4 | 63.5 | 3.2 |
| Sum | 2476.6 | 1981.3 | 100 |
| Table 8. Chipper productivity, load data, distance and time consumption for transport activities based on automated assignment of processes. |
| | Productivity of the Chipper [odt/PSH15] | Load/Truck [odt] | Chipping site-plant distance [km] | Time consumption/ distance [h] |
| Mean | 12.8 | 13.8 | 53.7 | 1.4 |
| Maximum | 29.7 | 18.2 | 97.0 | 2.9 |
| Minimum | 5.3 | 5.3 | 28.0 | 0.7 |
| 5th percentile | 6.2 | 9.6 | 35.0 | 0.9 |
| 95th percentile | 20.7 | 16.9 | 85.0 | 2.1 |
| [n] | 242 | 242 | 253 | 253 |
| Table 9. Fuel consumption [l/100 km] based on the electronic fueling data of the enterprise. |
| Vehicle ID | Mean | Maximum | Minimum. | 5th percentile | 95th percentile | [n] |
| 184-1 | 47.7 | 61.5 | 20.4 | 41.7 | 56.2 | 76 |
| 214-2 | 48.3 | 73.1 | 26.4 | 29.7 | 69.7 | 28 |
| 728-3 | 56.8 | 85.1 | 31.8 | 43.9 | 78.2 | 63 |
| 734-4 | 45.9 | 78.8 | 20.7 | 24.4 | 61.8 | 67 |
| Sum | 49.7 | 85.1 | 20.4 | 34.4 | 71.5 | 234 |
| Table 10. Fuel consumption based on the analyzed FMS-data of vehicle 728-3. |
| Consumption | Mean | Maximum | Minimum. | 5th percentile | 95th percentile | [n] |
All activities
[l/100 km] | 54.7 | 88.0 | 25.9 | 39.9 | 80.3 | 191 |
Driving
[l/100 km] | 50.0 | 90.0 | 24.0 | 38.0 | 69.6 | 215 |
| Table 11. Fuel consumption of the chipper. |
| Fuel consumption | Mean | Maximum | Minimum. | 5th percentile | 95th percentile | [n] |
| [l/h] | 40.5 | 130.6 | 20.2 | 21.6 | 92.3 | 127 |
| [l/machine hour] | 57.6 | 143.4 | 21.4 | 25.0 | 105.4 | 151 |
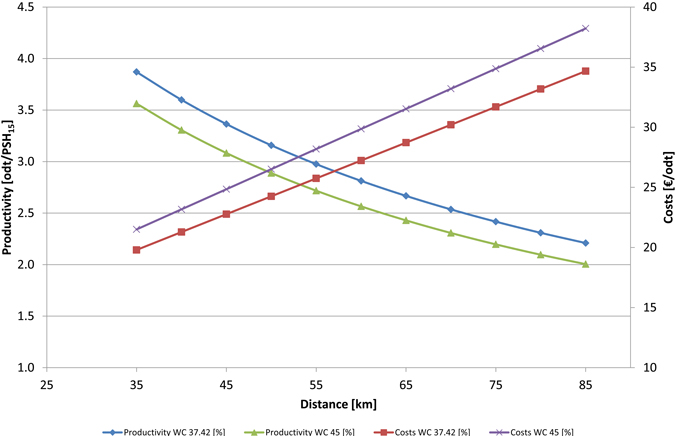
Fig. 3. Effects of moisture content on transport productivity costs that are based on recorded data.
| Table 12. Cost calculation for the equipment used in the study based on the conditions during data recording. |
| Component | Figure |
| Hardware server [€] | 4657.50 |
| Hardware vehicle [€] | 13925.00 |
| Software server [€] | 9885.00 |
| Software vehicle [€] | 2860.00 |
| Installation [€] | 12249.00 |
| Additional costs [€/month] | 119.00 |
| Summarized costs | 43576.50 |
| Depreciation [years] | 5 |
| Number of vehicles | 5 |
| Number of loads [n/a] | 200 |
| Costs without taxes [€/odt] | 0.72 |