| Table 1. Average value of log descriptors for appearance and structural grades. | |||||
| Production objective: | Appearance grades | Structural grades | |||
| Variable | 1st log | 2nd log | 3rd log | 2nd log | 3rd log |
| Small end diameter (SED, cm) | |||||
| Average | 38.52 | 35.86 | 33.51 | 44.91 | 39.77 |
| Standard deviation | 9.25 | 9.82 | 9.02 | 8.41 | 7.71 |
| Log volume (VOL, m3) | |||||
| Average | 0.73 | 0.55 | 0.43 | 0.89 | 0.73 |
| Standard deviation | 0.36 | 0.27 | 0.23 | 0.32 | 0.27 |
| Form (FORM) | |||||
| Average | 0.73 | 0.79 | 0.79 | 0.82 | 0.79 |
| Standard deviation | 0.07 | 0.09 | 0.07 | 0.03 | 0.03 |
| Mean Internode Length (MIL, cm) | |||||
| Average | 71.44 | 58.12 | |||
| Standard deviation | 17.5 | 19.6 | |||
| Largest branch (LBR, mm) | |||||
| Average | 56.64 | 66.55 | 60.29 | 73.33 | |
| Standard deviation | 28.9 | 23.7 | 21.0 | 26.6 | |
| Defect cylinder diameter (DCD mm) | |||||
| Average | 240.69 | ||||
| Standard deviation | 5.97 | ||||
| Pruned log index (PLI) | |||||
| Average | 4.83 | ||||
| Standard deviation | 1.81 | ||||
| Stiffness (STF, GPa) | |||||
| Average | 7.97 | 7.97 | |||
| Standard deviation | 1.47 | 1.26 | |||
| Number of logs | 54 | 57 | 45 | 35 | 36 |
| Log length (LL, cm) | 505 | 505 | 410 | 500 | 500 |
| Table 2. Descriptive statistics of lumber volume (m3) per tree. | ||||
| Mean values of trees | Appearance trees | Appearance-structural | Structural | |
| DBH | cm | 50.36 | 61.03 | 61.03 |
| Total height | m | 33.31 | 40.03 | 40.03 |
| Defect core diameter | mm | 246.33 | 281.37 | |
| Log pruned index (PLI) | 5.28 | 6.71 | ||
| Volume log 1 | m3 | 0.78 | 1.08 | 1.08 |
| Volume log 2 | m3 | 0.59 | 0.90 | 0.90 |
| Volume log 3 | m3 | 0.42 | 0.72 | 0.72 |
| Volume logs 4,5,6 | m3 | 0.55 | 1.17 | 1.17 |
| Pulp volume | m3 | 0.22 | 0.25 | 0.25 |
| Table 3. Pearson correlation coefficients between tree attributes and tree value. | ||
| Tree category | Diameter at breast high (DBH) | Stiffness (STF) |
| Appearance | ||
| NZ $/tree | 0.95* | |
| NZ $/m3 tree | 0.78* | |
| Appearance-structural | ||
| NZ $/tree | 0.67* | 0.17 |
| NZ $/m3 tree | –0.18 | 0.82* |
| Structural | ||
| NZ $/tree | 0.52* | 0.24 |
| NZ $/m3 tree | –0.20 | 0.82* |
| *Significant at 0.05 level. | ||
| Table 4. Descriptive statistics of the average tree returns under five scenarios (Rij), and the average MAD per scenario. | |||||
| Tree groups | Scenario1 | Scenario2 | Scenario3 | Scenario4 | Scenario5 |
| Appearance | |||||
| Mean value (NZ $/tree/ year) | 0.59 | 1.02 | 0.59 | –0.62 | 1.59 |
| Maximum value | 1.88 | 2.76 | 1.88 | 0.12 | 3.92 |
| Minimum value | –0.30 | –0.16 | –0.30 | –1.44 | 0.04 |
| MAD | 0.07 | 0.39 | 0.07 | 1.25 | 0.95 |
| Appearance-structural | |||||
| Mean value (NZ $/tree/ year) | 1.22 | 1.66 | 2.26 | –0.46 | 4.62 |
| Maximum value | 2.58 | 3.21 | 3.77 | –0.05 | 7.67 |
| Minimum value | –0.15 | –0.17 | 0.07 | –0.71 | 1.88 |
| MAD | 0.64 | 0.30 | 0.57 | 2.32 | 2.76 |
| Structural | |||||
| Mean value (NZ $/tree/ year) | 0.76 | 1.06 | 1.75 | –0.44 | 4.57 |
| Maximum value | 2.94 | 3.76 | 3.59 | –0.08 | 8.31 |
| Minimum value | –1.76 | –1.97 | –0.07 | –1.18 | 0.93 |
| MAD | 0.78 | 0.49 | 0.27 | 1.98 | 3.03 |
| Table 5. Value increase on logs and trees due to volume and stiffness increase. | |||
| Appearance | Appearance-structural | Structural | |
| Volume increase | |||
| Butt log | 31% | 17% | 21% |
| Second log | 32% | 22% | 22% |
| Third log | 31% | 23% | 23% |
| Tree | 29% | 19% | 22% |
| Stiffness increase | |||
| Butt log | 0% | 0% | 71% |
| Second log | 0% | 58% | 58% |
| Third log | 0% | 81% | 81% |
| Tree | 0% | 32% | 52% |
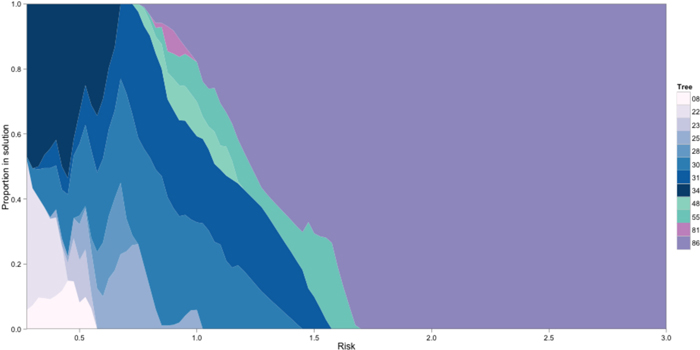
Fig. 1. Proportion of trees selected in the solution for different levels of risk. The solutions include appearance (8, 22, 23, 25, 28, 30, 31, 34, blue palette), appearance-structural (48 and 55, green palette) and structural (81 and 86, purple palette) trees.
| Table 6. Characteristics of the five trees selected in the portfolio analysis. | |||||||||
| Tree DBH (cm) | Butt log SED (cm) | 2nd log SED (cm) | 3rd log SED (cm) | 1st log STF (GPa) | 2nd log STF (GPa) | 3rd log STF (GPa) | 2nd log STF/SED | 3rd log STF/SED | |
| Structural trees | |||||||||
| Tree 86 | 55.3 | 44.4 | 40.8 | 36.2 | 9.91 | 11.6 | 10.6 | 0.28 | 0.29 |
| Tree 81 | 56.5 | 41.8 | 36.4 | 31.7 | 7.11 | 9.5 | 8.5 | 0.26 | 0.28 |
| Appearance-structural trees | |||||||||
| Tree DBH (cm) | Butt log SED (cm) | 2nd log SED (cm) | 3rd log SED (cm) | 1st log PLI | 2nd log STF (GPa) | 3rd log STF (GPa) | 2nd log STF/SED | 3rd log STF/SED | |
| Tree 55 | 56.7 | 48.2 | 43.3 | 39.8 | 6.7 | 9.1 | 8.9 | 0.21 | 0.22 |
| Tree 48 | 75.9 | 60.4 | 56.3 | 50.6 | 7.3 | 7.9 | 8.0 | 0.14 | 0.16 |
| Appearance trees | |||||||||
| Tree DBH (cm) | Butt log SED (cm) | 2nd log SED (cm) | 3rd log SED (cm) | 1st log PLI | 2nd log MIL (cm) | 3rd log MIL (cm) | 2nd log BIL (cm) | 3rd log BIL (cm) | |
| Tree 34 | 58.0 | 46.5 | 43.5 | 38.9 | 6.3 | 189 | 83 | 179 | 112 |
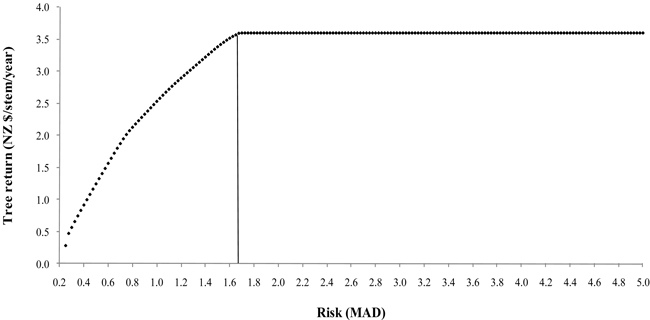
Fig. 2. Portfolio efficiency frontier for the selected trees.