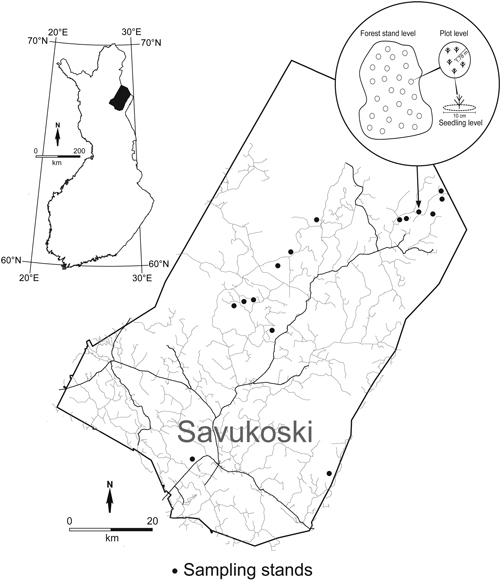
Fig. 1. Location of the regeneration stands and schematic illustration of data hierarchy. Parameters were measured either at forest stand level, plot level (25 plots of 10 m2 on each stand) or seedling level (5 cm radius around a seedling).
| Table 1. The characteristics of the forest stands (the averages at stand level). Expression “est. since cut” denotes the seedlings that have been emerged since seed-tree cutting. | |||||||
| Mean | 95% cl. lower | 95% cl. upper | Sd | Min | Max | Median | |
| Temperature sum, d.d. | 690 | 678 | 701 | 23 | 659 | 757 | 694 |
| Elevation, m asl | 257 | 242 | 272 | 30 | 207 | 310 | 260 |
| Time since seed-tree cut, years | 12 | 10 | 13 | 4 | 6 | 17 | 11 |
| Number of seed trees ha–1 | 33 | 19 | 48 | 28 | 13 | 120 | 24 |
| Thickness of humus layer, cm | 2.0 | 1.4 | 2.6 | 1.2 | 0.5 | 5.8 | 1.7 |
| Cover of crowberry, % | 15.4 | 11.3 | 19.6 | 8.2 | 0.7 | 33.0 | 13.5 |
| Cover of heather, % | 11.1 | 5.9 | 16.2 | 10.2 | 0.0 | 34.2 | 11.8 |
| Cover of lingonberry, % | 2.0 | 1.1 | 2.8 | 1.7 | 0.4 | 6.5 | 1.7 |
| Cover of bilberry, % | 6.3 | 3.9 | 8.8 | 4.8 | 0.4 | 16.2 | 5.9 |
| Cover of Polytrichum spp., % | 8.8 | 5.1 | 12.5 | 7.3 | 1.1 | 23.3 | 7.9 |
| Cover of other mosses, % | 21.6 | 15.5 | 27.7 | 12.1 | 2.7 | 44.7 | 24.0 |
| Cover of reindeer lichens, % | 16.1 | 9.8 | 22.4 | 12.4 | 0.4 | 44.8 | 15.0 |
| Cover of other lichens, % | 3.2 | 1.5 | 4.8 | 3.2 | 0.0 | 10.5 | 1.6 |
| Cover of exposed mineral soil, % | 5.2 | 2.0 | 8.5 | 6.1 | 0.0 | 16.4 | 1.5 |
| Number of pine seedlings (est. since cut) ha–1 | 1387 | 658 | 2116 | 1441 | 160 | 5200 | 1120 |
| Total number of pine seedlings / saplings ha–1 | 1874 | 943 | 2806 | 1840 | 240 | 7033 | 1280 |
| Total number of spruce seedlings /saplings ha–1 | 273 | 92 | 455 | 359 | 0 | 1120 | 120 |
| Total number of birch seedlings / saplings ha–1 | 1167 | 662 | 1672 | 998 | 40 | 3680 | 920 |
| Age of pine seedlings (est. since cut), years | 6 | 5 | 7 | 2 | 3 | 10 | 6 |
| Height of seedlings (est. since cut), cm | 17.8 | 12.5 | 23.1 | 10.5 | 5.0 | 43.2 | 16.3 |
| Table 2. The results of permutation tests for the CCA analysis. The test is for the marginal effects of the constraining terms. N.Perm denotes the number of permutations. | |||||
| Df | Chi-square | F | N.Perm | p | |
| Thickness of humus layer, cm (HUM) | 1 | 0.009 | 2.690 | 299 | 0.017 |
| Stoniness, (S1, categories: 1 = stony, 0 = not stony, measured on a sample plot) | 1 | 0.014 | 4.352 | 199 | 0.005 |
| Total number of pine seedlings on a sample plot (PINE) | 1 | 0.014 | 4.389 | 199 | 0.005 |
| Total number of spruce seedlings on a sample plot (SPRUCE) | 1 | 0.008 | 2.347 | 399 | 0.023 |
| Residual | 356 | 1.166 | |||
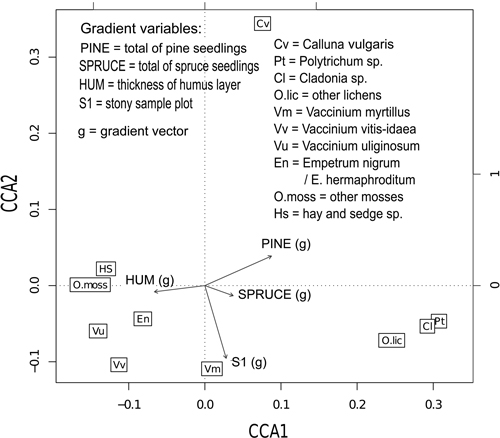
Fig. 2. Canonical correspondence analysis (CCA) plot describing the relations involved in the ground- and bottom-layer vegetation and the statistically significant (at 5% risk level) gradient variables indicated by gradient vectors.
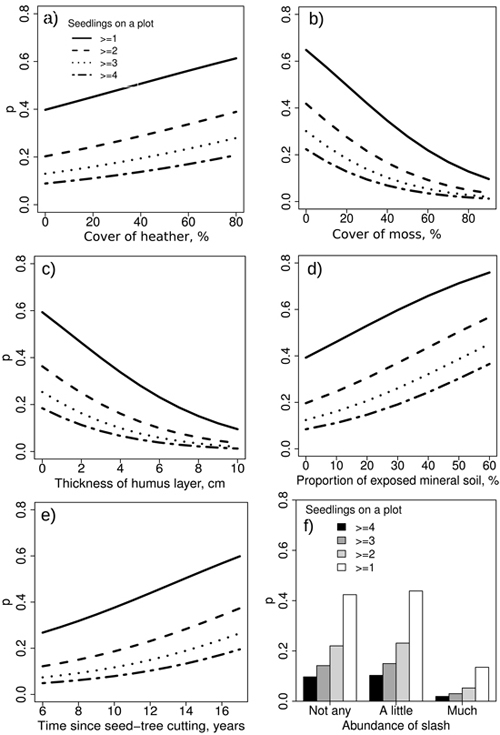
Fig. 3. The predicted seedling establishment probabilities by independent variables in Model 1. The covers were measured at plot level.
| Table 3. The ordered multinomial regression model with a random factor for predicting the numbers of seedlings on a sample plot emerged after the seed-tree cutting (Model 1). The joined Wald tests were calculated as a general test for the categorical variables. Approximate confidence intervals for random and scale parameters are presented. Pl denotes measurement at plot and st at stand level (in the parenthesis). | |||||
| Variable | Estimate | Std.error | Wald | df | p |
| Fixed effects | |||||
| Intercept (≥ 4 seedling on a plot, pl) | –2.918 | 1.119 | 6.797 | 1 | 0.009 |
| Intercept (≥ 3 seedling on a plot, pl) | –2.423 | 1.116 | 4.714 | 1 | 0.030 |
| Intercept (≥ 2 seedling on a plot, pl) | –1.787 | 1.113 | 2.575 | 1 | 0.109 |
| Intercept (≥ 1 seedling on a plot, pl) | –0.603 | 1.110 | 0.295 | 1 | 0.587 |
| Time since seed-tree cutting, years (st) | 0.164 | 0.088 | 3.476 | 1 | 0.062 |
| Thickness of humus layer, cm (pl) | –0.332 | 0.076 | 19.089 | 1 | 0.000 |
| Cover of moss species, % (pl) | –0.039 | 0.007 | 30.527 | 1 | 0.000 |
| Cover of heather, %, (pl) | 0.014 | 0.006 | 5.037 | 1 | 0.025 |
| Cover of exposed mineral soil, % (pl) | 0.034 | 0.015 | 4.919 | 1 | 0.027 |
| Abundance of slash and other cutting waste (joined test, pl) | 12.619 | 2 | 0.002 | ||
| Much | –1.948 | 0.578 | 11.341 | 1 | 0.001 |
| A little | 0.080 | 0.223 | 0.129 | 1 | 0.719 |
| Not any (ref. category) | 0.000 | 0.000 | - | - | - |
| Random effects | Estimate | 95 % confidence intervals | |||
| Variance of random intercept of forest stand σj2 | 1.162 | 0.244–2.080 | |||
| Scale parameter (compare to 1) | 0.814 | 0.754–0.874 | |||
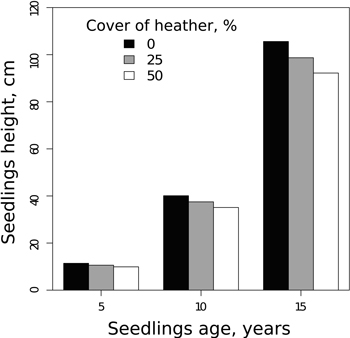
Fig. 4. The predictions for the effect of heather cover on the average height of the pine seedlings calculated at 5, 10 and 15 year seedling age (Model 2).
| Table 4. The estimates and significance tests for the model of pine seedling height (median height on a plot) (Model 2). The response variable is the logarithm of the height of the seedlings on a sample plot that were emerged since seed-tree cutting. The model was done for the forest stands where the average of temperature sum during 1960–1991 was < 750 (one stand omitted), and the maximum age was 15 years (one sample plot omitted). The R2 basing on the fixed predictions was 71.5%. Pl denotes measurement at plot and st at stand level (in the parenthesis). | |||||
| Variable | Estimate | Std. error | df | t | p |
| Fixed part | |||||
| Intercept (pl) | –5.668 | 1.524 | 126 | –3.719 | 0.000 |
| Age of seedling of median height, years (pl) | –0.195 | 0.071 | 126 | –2.755 | 0.007 |
| Square root of age of median height seedling, years (pl) | 2.366 | 0.351 | 126 | 6.733 | 0.000 |
| Cover of heather, % (pl) | –0.002 | 0.001 | 126 | –1.733 | 0.086 |
| Cover of lingonberry, % (pl) | 0.019 | 0.006 | 126 | 2.878 | 0.005 |
| Temperature sum, d.d. (st) | 0.005 | 0.002 | 12 | 2.602 | 0.021 |
| Random part | Estimate | 95% confidence intervals | |||
| Variance of random intercept of forest stand σj2 | 0.002 | 0.000–0.742 | |||
| Residual σij2 | 0.088 | 0.069–0.112 | |||
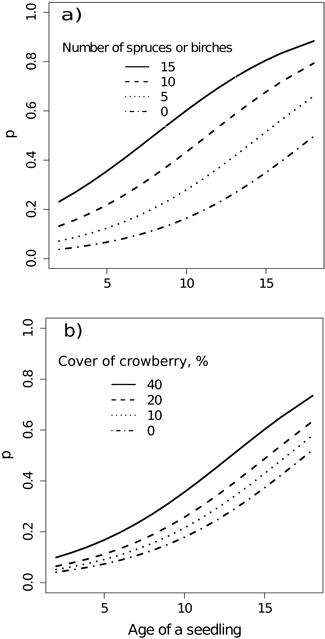
Fig. 5. Predicted probability (p) of the occurrence of dead or dying seedlings by the independent variables (Model 3). The number of spruce and birch seedlings was measured at plot level and the cover of crowberry at the base of a seedling (at seedling level).
| Table 5. The estimates of the model for predicting the probability of a seedling’s poor health (seedling classified as dead or dying) (Model 3). The maximum of the total number of seedlings was restricted as <20 seedlings on a plot for computational reasons. Thus the total number of seedlings in the model was 491 out of 510. Pl denotes measurement at plot and se at seedling level (in the parenthesis). | |||||
| Variable | Estimate | Std.error | t-value | df | p |
| Fixed effects | |||||
| Intercept (se) | –4.208 | 0.484 | 333 | –8.690 | 0.000 |
| Age of a seedling, years (se) | 0.202 | 0.040 | 333 | 5.007 | 0.000 |
| Total number of seedlings (pl) | 0.081 | 0.040 | 139 | 2.084 | 0.039 |
| Cover of crowberry at seedling’s base (se) | 0.026 | 0.008 | 333 | 3.198 | 0.002 |
| Cover of lichens at seedling’s base (se) | 0.015 | 0.008 | 333 | 1.994 | 0.047 |
| Random effects | Estimate | 95% confidence intervals | |||
| Variance of random intercept of forest stand σj2 | 0.024 | 0.000–1.230e+03 | |||
| Variance of random intercept of sample plot σij2 | 1.429 | 0.800–2.553 | |||
| Scale parameter (compare to 1) | 0.624 | 0.542–0.719 | |||