| Table 1. Parameters defining stand location, productivity, discount rate and the resulting sets of optimisation sub-problems. |
| Parameters defining stand location, productivity, demand to economic return |
| Stand location | Latitude, °N | lat | = {60, 64} |
| Altitude, m.a.s.l. | alt | = {100, 200, 300, 400} |
| Stand productivity | Site index, SIH(100) | SIH | = {T16, T18, T20, T22, T24, T26, T28} |
| | Discount rate, % | r | = {1.0, 1.5, 2.0, 2.5, 3.0} |
| The parameters above generate 280 combinations. For each of these, 2 × 4 sub-problems were solved separately. |
| Silvicultural decisions | Regeneration method | RM | = {Planting, Seed-tree-method} |
| Number of thinnings | TH | = {0, 1, 2, 3} |
| Table 2. Decision variables. |
| Regeneration by planting | Natural regeneration by seed trees |
| · Number of seedlings planted (seedlings ha–1) | · Number of soil treatment patches (patches ha–1) |
| · Number of seed trees (stems ha–1) |
| · Seed tree period, years |
| · Intensity of pre commercial thinning, fraction of stems removed |
| For each thinning i = {0, 1, 2, 3} |
| · Age of thinning i, years |
| · Intensity of thinning i, fraction of basal area removed |
| · Diameter quota Q = Dt/Dr, where Dt is the diameter of stems removed by thinning and Dr is the diameter of the remaining stems |
| · Age of final harvest, years | · Age of regeneration harvest, years |
| Table 3. Difference between the best scenario of planting and natural regeneration. Genetically unimproved planting material. Results for 8 different stand locations and 7 levels of productivity. |
| Latitude °N | Altitude m.a.s.l. | Discount rate | Site index (SIH(100), m) |
| T16 | T18 | T20 | T22 | T24 | T26 | T28 |
| 60 | 100 | 1.0% | –230 | N1 | –324 | N1 | –306 | N1 | –207 | N1 | –66 | N1 | 90 | P1 | 281 | P1 |
| 1.5% | –125 | N0 | –177 | N1 | –206 | N1 | –187 | N1 | –116 | N1 | 6 | P1 | 126 | P1 |
| 2.0% | –112 | N0* | –129 | N0 | –140 | N1 | –138 | N1 | –108 | N1 | –29 | N1 | 61 | P1 |
| 2.5% | –100 | N0* | –112 | N0* | –125 | N0* | –118 | N0 | –103 | N1 | –56 | N1 | 19 | P1 |
| 3.0% | –94 | N0* | –102 | N0* | –113 | N0* | –106 | N0* | –96 | N0 | –62 | N1 | –13 | N1 |
| 200 | 1.0% | –264 | N1 | –361 | N1 | –358 | N1 | –257 | N1 | –110 | N1 | 47 | P1 | 241 | P1 |
| 1.5% | –138 | N0 | –194 | N1 | –232 | N1 | –221 | N1 | –150 | N1 | –8 | N1 | 127 | P1 |
| 2.0% | –125 | N0* | –138 | N0 | –156 | N1 | –162 | N1 | –131 | N1 | –56 | N1 | 50 | P1 |
| 2.5% | –112 | N0* | –122 | N0* | –134 | N0* | –124 | N0 | –121 | N1 | –78 | N1 | 8 | P1 |
| 3.0% | –105 | N0* | –112 | N0* | –123 | N0* | –116 | N0* | –106 | N0 | –72 | N1 | –23 | N1 |
| 300 | 1.0% | –293 | N1 | –398 | N1 | –417 | N1 | –313 | N1 | –158 | N1 | 15 | P1 | 185 | P1 |
| 1.5% | –157 | N0 | –214 | N1 | –260 | N1 | –256 | N1 | –184 | N1 | –45 | N1 | 98 | P1 |
| 2.0% | –139 | N0* | –149 | N0 | –166 | N1 | –180 | N1 | –159 | N1 | –86 | N1 | 38 | P1 |
| 2.5% | –125 | N0* | –133 | N0* | –141 | N0 | –135 | N0 | –133 | N1 | –91 | N1 | –2 | N1 |
| 3.0% | –117 | N0* | –122 | N0* | –128 | N0* | –126 | N0* | –116 | N0 | –82 | N1 | –33 | N1 |
| 400 | 1.0% | –298 | N1 | –428 | N1 | –470 | N1 | –370 | N1 | –208 | N1 | –25 | N1 | 150 | P1 |
| 1.5% | –174 | N0 | –218 | N1 | –277 | N1 | –285 | N1 | –221 | N1 | –81 | N1 | 74 | P1 |
| 2.0% | –155 | N0* | –162 | N0 | –167 | N1 | –186 | N1 | –184 | N1 | –103 | N1 | 25 | P1 |
| 2.5% | –139 | N0* | –145 | N0* | –151 | N0 | –148 | N0 | –139 | N1 | –108 | N1 | –25 | N1 |
| 3.0% | –131 | N0* | –133 | N0* | –139 | N0* | –137 | N0* | –128 | N0 | –90 | N0 | –50 | N1 |
| 64 | 100 | 1.0% | –339 | N1 | –426 | N1 | –455 | N1 | –349 | N1 | –186 | N1 | –13 | N1 | 75 | P1 |
| 1.5% | –159 | N0 | –205 | N1 | –236 | N1 | –258 | N1 | –207 | N1 | –60 | N1 | 97 | P1 |
| 2.0% | –141 | N0* | –151 | N0 | –154 | N0 | –160 | N1 | –154 | N1 | –97 | N1 | 43 | P1 |
| 2.5% | –127 | N0* | –137 | N0* | –141 | N0 | –136 | N0 | –119 | N0 | –77 | N1 | –5 | N1 |
| 3.0% | –120 | N0* | –126 | N0* | –131 | N0* | –128 | N0* | –116 | N0 | –76 | N0 | –33 | N0 |
| 200 | 1.0% | –371 | N1 | –430 | N1 | –486 | N1 | –414 | N1 | –242 | N1 | –66 | N1 | 34 | P1 |
| 1.5% | –181 | N1 | –208 | N1 | –240 | N1 | –262 | N1 | –249 | N1 | –103 | N1 | 73 | P1 |
| 2.0% | –158 | N0* | –166 | N0 | –168 | N0 | –164 | N1 | –159 | N1 | –111 | N1 | –10 | N1 |
| 2.5% | –143 | N0* | –150 | N0* | –155 | N0 | –150 | N0 | –132 | N0 | –83 | N1 | –14 | N1 |
| 3.0% | –135 | N0* | –139 | N0* | –143 | N0* | –140 | N0* | –129 | N0 | –87 | N0 | –45 | N0 |
| 300 | 1.0% | –378 | N1 | –427 | N1 | –486 | N1 | –496 | N1 | –308 | N1 | –114 | N1 | 3 | P1 |
| 1.5% | –201 | N0 | –207 | N1 | –240 | N1 | –263 | N1 | –256 | N1 | –150 | N1 | 40 | P1 |
| 2.0% | –178 | N0* | –179 | N0 | –180 | N0 | –168 | N0 | –161 | N1 | –113 | N1 | –12 | N1 |
| 2.5% | –163 | N0* | –163 | N0* | –166 | N0 | –160 | N0 | –141 | N0 | –90 | N0 | –20 | N0 |
| 3.0% | –154 | N0* | –151 | N0* | –154 | N0* | –150 | N0* | –137 | N0 | –95 | N0 | –51 | N0 |
| 400 | 1.0% | –362 | N1 | –373 | N1 | –474 | N1 | –510 | N1 | –391 | N1 | –187 | N1 | 15 | P1 |
| 1.5% | –221 | N0 | –221 | N0 | –230 | N1 | –257 | N1 | –253 | N1 | –182 | N1 | –2 | N1 |
| 2.0% | –200 | N0* | –194 | N0 | –193 | N0 | –179 | N0 | –158 | N1 | –111 | N1 | –10 | N1 |
| 2.5% | –182 | N0* | –178 | N0* | –180 | N0 | –172 | N0 | –149 | N0 | –97 | N0 | –25 | N0 |
| 3.0% | –173 | N0* | –167 | N0* | –168 | N0* | –161 | N0* | –148 | N0 | –103 | N0 | –56 | N0 |
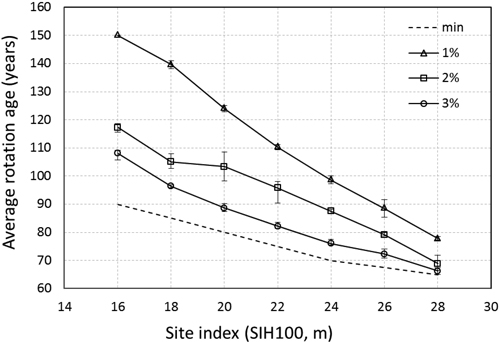
Fig. 1. Average age of regeneration harvest for all latitudes and altitudes and three discount rates. min denotes the minimum harvest age (Skogsstyrelsens föreskrifter… 2009). The bars denote maximum and minimum values.
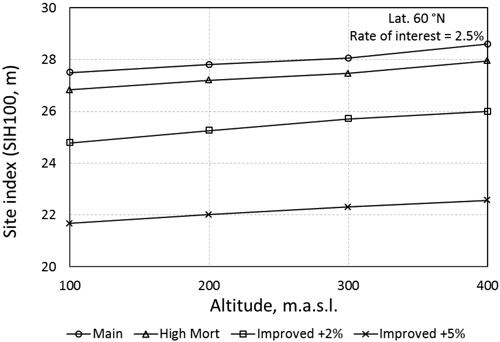
Fig. 2. Break-even site index at latitude 60°N and a discount rate of 2.5%. The break-even site index was calculated by linear interpolation except for the two points lying above SIH 28. Here linear extrapolation was used.
| Table 4. Difference in net present value between the best option for planting and for natural regeneration. Scenarios for two levels of genetic gain to growth compared to natural regeneration; and a scenario of higher mortality for seed trees compared to unimproved planting material. Latitude 60°N, Altitude 100 m.a.s.l. Compare to the first five rows in Table 3. |
| Scenario | Discount
rate | Site index (SIH(100), m) |
| T16 | T18 | T20 | T22 | T24 | T26 | T28 |
| Genetically improved seedlings,+2% to site index | 1.0% | –178 | N1 | –235 | N1 | –151 | N1 | 28 | P1 | 271 | P1 | 553 | P1 | 908 | P1 |
| 1.5% | –108 | N0 | –145 | N1 | –134 | N1 | –67 | N1 | 74 | P1 | 261 | P1 | 474 | P1 |
| 2.0% | –106 | N0* | –117 | N0 | –101 | N1 | –72 | N1 | –2 | N1 | 136 | P1 | 283 | P1 |
| 2.5% | –100 | N0* | –107 | N0* | –107 | N0* | –77 | N0 | –35 | N1 | 54 | P1 | 165 | P1 |
| 3.0% | –98 | N0* | –102 | N0* | –106 | N0* | –85 | N0* | –56 | N0 | 8 | P1 | 81 | P1 |
| Genetically improved seedlings,+5% to site index | 1.0% | –76 | N1 | –67 | N1 | 138 | P1 | 447 | P1 | 847 | P1 | 1345 | P1 | 1956 | P1 |
| 1.5% | –62 | N0 | –61 | N1 | 8 | P1 | 163 | P1 | 414 | P1 | 711 | P1 | 1105 | P1 |
| 2.0% | –79 | N0* | –73 | N0 | –15 | N1 | 62 | P1 | 208 | P1 | 430 | P1 | 676 | P1 |
| 2.5% | –84 | N0* | –80 | N0* | –48 | N0* | 9 | P0 | 105 | P1 | 266 | P1 | 419 | P1 |
| 3.0% | –88 | N0* | –84 | N0* | –64 | N0* | –26 | N0* | 37 | P0 | 156 | P1 | 252 | P1 |
| Higher rate of annual mortality for seed trees, 1% instead of 0.5% | 1.0% | –201 | N1 | –294 | N1 | –271 | N1 | –167 | N1 | –21 | N1 | 131 | P1 | 332 | P1 |
| 1.5% | –103 | N0 | –152 | N1 | –177 | N1 | –155 | N1 | –79 | N1 | 47 | P1 | 171 | P1 |
| 2.0% | –94 | N0* | –110 | N0 | –121 | N1 | –117 | N1 | –86 | N1 | –2 | N1 | 91 | P1 |
| 2.5% | –90 | N0* | –99 | N0* | –109 | N0* | –98 | N0 | –86 | N1 | –32 | N1 | 45 | P1 |
| 3.0% | –85 | N0* | –90 | N0* | –97 | N0* | –87 | N0* | –77 | N0 | –39 | N1 | 12 | P1 |