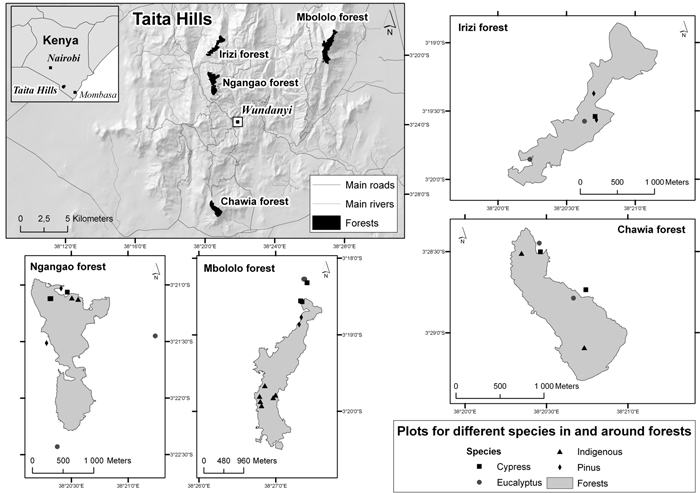
Fig. 1. Location of the four forest areas and study plots in the Taita Hills, Kenya (maps drawn by Mika Siljander, Dept. of Geosciences and Geography, University of Helsinki).
| Table 1. Characteristics of the four forest areas and number of study plots. | ||||
| Characteristic | Forest area | |||
| Ngangao | Chawia | Irizi | Mbololo | |
| Latitude (S) | 03°21′55″ | 03°28′48″ | 03°19′40″ | 03°18′15″ |
| Longitude (E) | 38°20′33″ | 38°20′31″ | 38°20′45″ | 38°29′45″ |
| Elevation (m a.s.l.) | 1700–1952 | 1470–1600 | 1640–1705 | 1000–1779 |
| Slope (%) | 6–27 | 1–13 | 3–25 | 4–44 |
| Area (ha) | 206 | 111 | 47 | 185 |
| MAT (°C) a) | 17.8 | 18.9 | 18.5 | 18.6 |
| MAP (mm) b) | 1773 c) | 1285 c) | 1450 | 1716 c) |
| No. of plots d) | 9 (2, 3, 2, 2) | 6 (2, 2, 2, -) | 9 (-, 1, 4, 4) | 14 (4, 4, 2, 4) |
| a) Mean annual temperature, New LocClim (see text) values. b) Mean annual precipitation, New LocClim (see text) values. c) Value includes occult precipitation (+ 20% of annual precipitation). d) Values in parentheses are the number of plots by forest type: Indigenous, Cypress, Eucalyptus, Pine. | ||||
| Table 2. Stand and soil characteristics of study plots (stand by forest type and soil by layer) for the four study areas in the Taita Hills. View in new window/tab. |
| Table 3. Mean (± standard deviation) carbon densities (Mg C ha–1) in tree biomass and soil of the four forest types in the Taita Hills. Within each carbon stock, forest type mean values followed by different letters indicate a significant difference (Tukey’s test, p < 0.05). | ||||
| Stock | Indigenous (n = 8) | Cypress (n = 10) | Eucalyptus (n = 10) | Pine (n = 10) |
| Tree biomass C | ||||
| Aboveground | 360 ± 148.1a | 158 ± 66.6b | 221 ± 143.2ab | 195 ± 87.8b |
| Belowground | 90 ± 37.0a | 39 ± 17.8b | 72 ± 46.0ab | 47 ± 21.0b |
| Total | 450 ± 185.1a | 197 ± 84.3b | 292 ± 189.5ab | 242 ± 108.8b |
| SOC | ||||
| 0–20 cm | 146 ± 27.6a | 115 ± 23.3ab | 94 ± 33.7bc | 78 ± 31.2c |
| 20–50 cm | 158 ± 35.9a | 137 ± 27.8ab | 116 ± 45.1ab | 91 ± 43.5b |
| 0–50 cm | 305 ± 58.1a | 252 ± 48.0ab | 209 ± 77.4bc | 168 ± 72.5c |
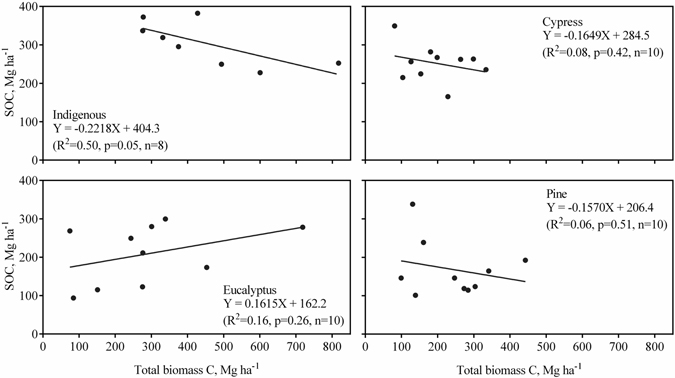
Fig. 2. Relationship between plot soil organic carbon (SOC, 0–50 cm) and total biomass carbon densities for each of the four forest types. Lines are linear regression lines.
| Table 4. Correlations (Spearman) between plot mean carbon densities (Mg ha–1) for tree biomass (total) and soil (0–50 cm) and various climate and site variables by forest type. Values in bold denote significant correlation coefficients (p < 0.05). | ||||||||||
| Forest type | n | MAP a) | MAT a) | PET b) | AET c) | Elevation | Slope | Clay d) | PAWC e) | |
| Biomass (total) | Indigenous | 8 | –0.24 | 0.28 | 0.14 | 0.33 | –0.36 | –0.02 | 0.40 | –0.49 |
| Cypress | 10 | –0.35 | –0.25 | 0.02 | 0.44 | 0.19 | –0.38 | 0.16 | –0.19 | |
| Eucalyptus | 10 | –0.07 | 0.48 | –0.25 | 0.52 | –0.49 | 0.05 | 0.42 | 0.22 | |
| Pine | 10 | 0.10 | 0.52 | –0.03 | 0.84 | –0.53 | 0.48 | –0.09 | 0.14 | |
| Soil (0–50 cm) | Indigenous | 8 | 0.52 | –0.30 | –0.36 | 0.24 | 0.62 | 0.10 | –0.83 | 0.00 |
| Cypress | 10 | 0.55 | –0.55 | –0.56 | –0.31 | 0.58 | –0.44 | –0.52 | –0.49 | |
| Eucalyptus | 10 | 0.41 | 0.22 | –0.64 | 0.15 | –0.31 | –0.03 | –0.02 | –0.04 | |
| Pine | 10 | 0.68 | –0.34 | –0.67 | –0.32 | 0.67 | 0.35 | –0.31 | –0.45 | |
| a) Mean annual precipitation (including 20% cloud precipitation, except for Irizi) and mean annual temperature. b) Mean annual potential (Jensen-Haise alfalfa reference crop) evapotranspiration. c) Mean annual actual evapotranspiration. d) Clay (<0.002 mm) content (%) of 0–50 cm soil layer. e) Plant available water capacity (mm) of 0–50 cm soil layer calculated using method of Saxton et al. (1986). | ||||||||||