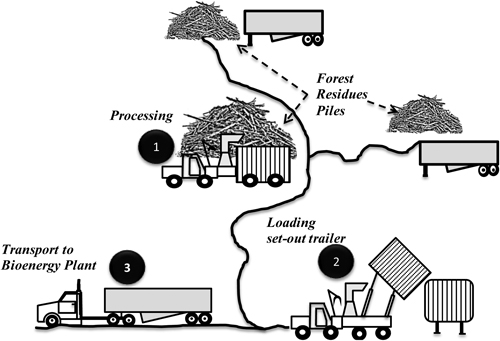
Fig. 1. Mobile chipper processing different piles of forest residues and loading the chips into trailers. The number located in the black circles describes the phases of the process.
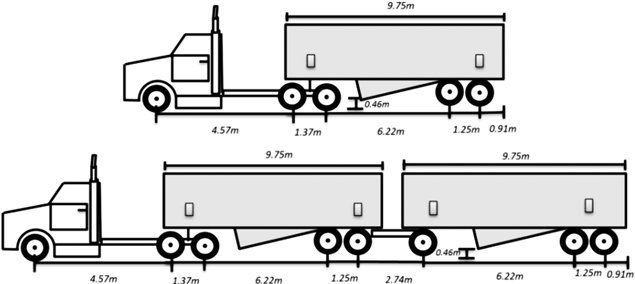
Fig. 2. Two typical tractor-trailer configurations, a) 6x4 tri-axle truck and single trailer approximately 15.5 t of capacity; b) 6x4 tri- axle truck and double trailer (9.75 and 9.75 m in length), with a capacity of 27.3 t.
| Table 1. Statistics of time spent in each activity of the productive chipping cycle. | |||||
| Mean | Min | Max | SD | % | |
| Chipping (min) | 16.45 | 8.07 | 40.78 | 5.52 | 75.80 |
| Travelling to trailer (min) | 1.83 | 0.47 | 6.73 | 1.12 | 8.44 |
| Dumping (min) | 1.46 | 0.45 | 3.07 | 0.51 | 6.74 |
| Returning to pile (min) | 1.96 | 0.25 | 6.62 | 1.30 | 9.02 |
| Total (min) | 21.70 | 9.24 | 57.20 | 8.46 | 100.00 |
| Bin-load (Green tonnes) | 4.09 | 2.09 | 6.01 | 0.70 | |
| Table 2. Fitted distributions for each operational process. | |||||
| Process | Probability distribution | Location parameter | Scale parameter | Shape parameter | Squared error and p-values |
| Chipping sorted (min) | Erlang | 8 | 1.63 | 4 | 0.0056; p > 0.75 |
| Chipping unsorted (min) | Gamma | 11 | 5.91 | 1.53 | 0.0023; p = 0.31 |
| Travelling to trailer (m/min) | Weibull | 1 | 44.3 | 1.66 | 0.0048; p = 0.51 |
| Dumping (min) | Log-Normal | 0.18 | 1.28 | 0.527 | 0.0042; p = 0.38 |
| Returning to pile (m/min) | Gamma | 6 | 14.7 | 2.16 | 0.0011; p = 0.73 |
| Bin-load (kg) | Normal | 4090 | 692 | 0 | 0.0116; p = 0.05 |
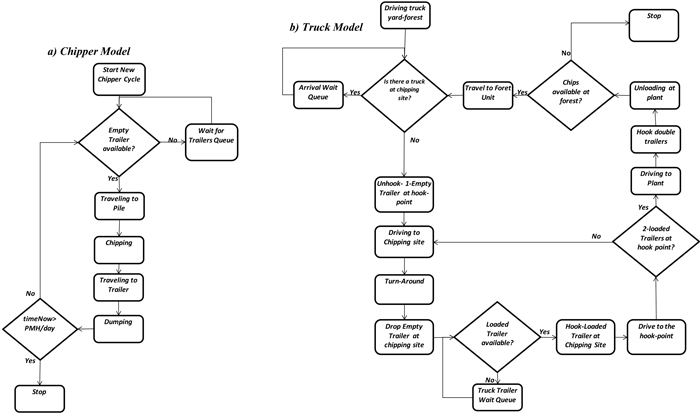
Fig. 3. Model logic: a) chipper; b) truck-double trailers. View larger in new window/tab.
| Table 3. Modeled and actual results for the validation study. | |||
| Process | Actual | Model | % difference |
| Chipping (min) | 882.99 | 893.59 ± 18.00 | 1.20, t29 = 1.492 |
| Travelling to trailer (min) | 101.52 | 107.75 ± 8.84 | 6.14, t29 = 1.734 |
| Dumping & record keeping (min) | 89.28 | 89.53 ± 3.50 | 0.28, t29 = 0.174 |
| Returning to pile (min) | 91.10 | 88.24 ± 4.14 | 3.14, t29 = 1.700 |
| Chips produced (t) | 277.72 | 279.36 ± 7.57 | 0.59, t29 = 2.329 |
| Total productive time (min) | 1164.88 | 1153.53 | 1.22 |
| Productivity (Green tonnes/productive hour) | 14.30 | 14.22 | 0.62 |
| Table 4. Estimated hourly cost for the Bruks chipper under the study conditions. | ||
| Cost $/hour | Operating | Standing |
| Interest, insurance, and taxes | 116.75 | 36.75 |
| Labor | 37.50 | 37.50 |
| Knife cost | 16.00 | - |
| Repair and maintenance | 56.00 | - |
| Fuel cost | 48.00 | - |
| Oil and lubricants | 17.64 | - |
| Total variable cost | 175.14 | 37.50 |
| Supportive equipment | 28.18 | 28.18 |
| Overhead | 19.67 | 19.67 |
| Profit and risk (7%) | 23.78 | 23.78 |
| Total $/hour | 363.51 | 145.87 |
| Table 5. Hourly transportation costs based on road standard and if truck is traveling empty or loaded. Single trailer is 9.8 m and double trailer is composed of two 9.8 m trailers. | ||||
| Truck-trailer configuration ($/h) | Paved | Gravel | Dirt | Standing |
| Single trailer truck empty | 80.32 | 68.37 | 65.73 | 45.34 |
| Single trailer truck loaded | 96.06 | 76.72 | 73.44 | 45.34 |
| Double trailer truck empty | 98.53 | 78.97 | 75.03 | 50.87 |
| Double trailer truck loaded | 126.19 | 92.11 | 89.03 | 50.87 |
| Table 6. Truck and trailer specifications. | ||
| Truck specifications | Single trailer truck (15.5 t) | Double trailer truck (27.3 t) |
| Truck weight (t) | 9.1 | 9.1 |
| Trailer weight (t) | 3.9 | 10.2 |
| Maximum capacity (t) | 15.5 | 27.3 |
| Number of axles | 5 | 9 |
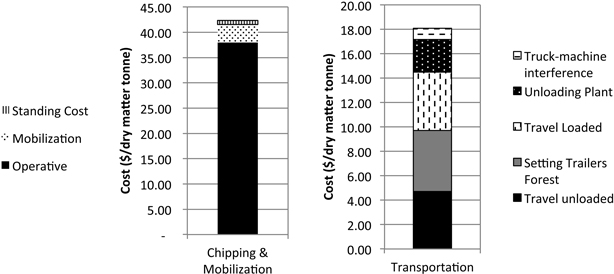
Fig. 4. Total cost of chipping and transportation for the validation forest unit.
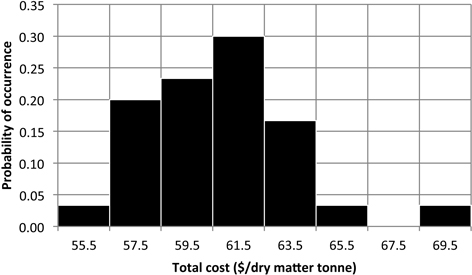
Fig. 5. Probability of total chipping and transportation cost for the validation forest unit.
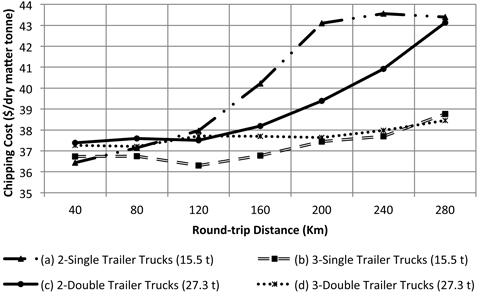
Fig. 6. Chipping cost as a function of the round-trip highway distance to bioenergy plant. Internal forest round-trip distance was fixed at 6 km.
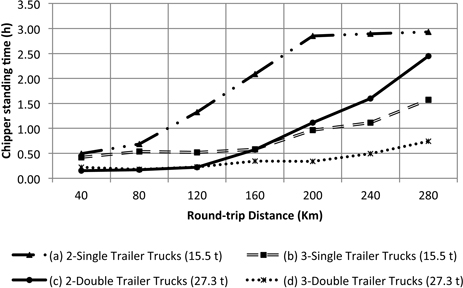
Fig. 7. Chipper standing time as a function of round-trip highway distance to bioenergy facility. Internal forest round-trip distance was fixed at 6 km.
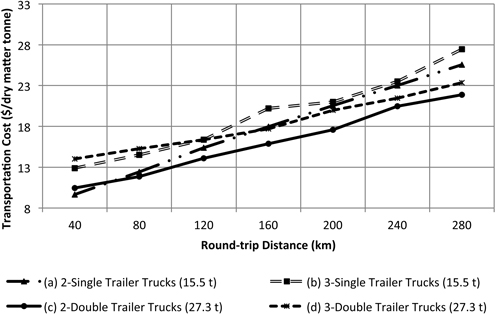
Fig. 8. Transportation cost as a function as a function for round-trip highway distance to the bioenergy facility. Internal forest round-trip distance was fixed at 6 km.
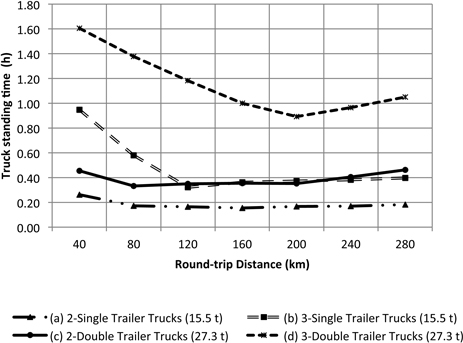
Fig. 9. Truck standing time at arrival due to road congestion and waiting for loaded trailers. Internal forest round-trip distance was fixed at 6 km.
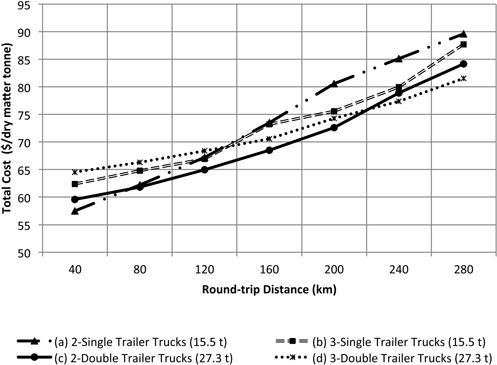
Fig. 10. Total costs as a function of the round-trip highway distance to the bioenergy plant. Internal forest round-trip distance was fixed at 6 km.
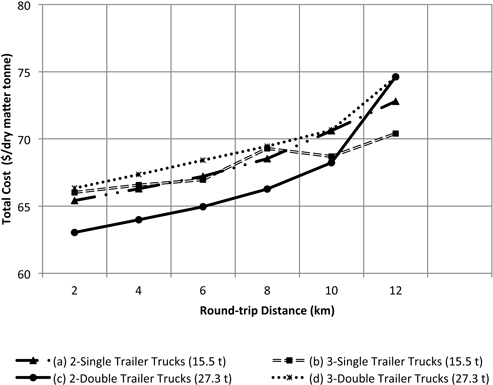
Fig. 11. Total costs as a function forest road distance for a highway haul round-trip distance of 120 km to the bioenergy plant.
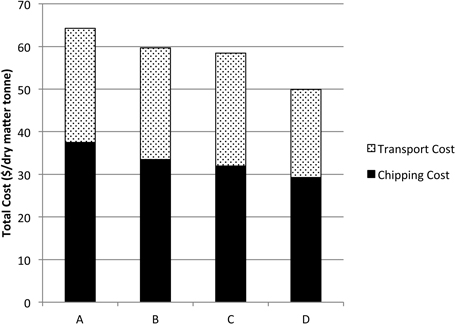
Fig. 12. Total costs for chipping at centralized landing with no machine movement. A) Actual cost using two double trailer trucks; B) total cost operating with no chipper movement and direct dumping into trailers and using 2 double trailer trucks; C) total cost with no machine movement but blowing directly the material into trailers and using two double trailer trucks; D) total cost with no machine movement but blowing directly the material into trailers and using three double trailer trucks.