| Table 1. Geographical position, altitude (meters above sea level), site index (Hägglund 1974) and year of stand establishment of the study sites used to compare silvicultural regime types (Dense/Sparse = a high initial stand density followed by high intensity pre-commercial thinning/commercial thinning, Dense = a continuous high stand density and Sparse = a continuous low stand density). | |||||
| Regime type | Site name | Geographical position | Alt. (m.a.s.l.) | SI (H100) | Year of stand establishment |
| Dense/Sparse | Svartberget (SVA) | 64°14´N, 19°46´E | 210 | 23 | 1948 |
| Svartberget | 64°14´N, 19°46´E | 210 | 23 | 1948 | |
| Norrliden (NOR) | 64°21´N, 19°46´E | 240 | 21 | 1956 | |
| Dense | Svartberget | 64°14´N, 19°46´E | 210 | 23 | 1948 |
| Kulbäcksliden (KUL) | 64°10´N, 19°35´E | 260 | 22 | 1934 | |
| Sparse | Åsele (ÅSE) | 64°14´N, 17°33´E | 330 | 23 | 1964 |
| Åheden (ÅHE) | 64°09´N, 19°40´E | 195 | 19 | 1948 | |
| Table 2. Characteristics of all sample trees included in the study. Site abbreviations are explained in Table 1. DBH = diameter at breast height; DGC = diameter at the lowest living branch (not surrounded by two dead branch whorls) of the green crown; D70 = diameter at 70% of total tree height. Dense/Sparse = a high initial stand density followed by high intensity pre-commercial thinning/commercial thinning, Dense = a continuous high stand density, and Sparse = a continuous low stand density. 300L = thinning leaving the 300 largest trees ha–1; 300S = thinning leaving the 300 smallest trees ha–1; P600 = PCT to 600 stems ha–1 at a dominant height of 5m; NT = no thinning; NP = no PCT; 3M = 3 m spacing; 10M = 10 m spacing. | |||||||||
| Regime type | Treatment | Site | No. of year rings at breast height | Height (m) | Height to living crown (m) | Height to living crown (% of tree height) | DBH (cm) | DGC (cm) | D70 (cm) |
| Dense/ Sparse | 300S | SVA | 46 | 14.3 | 6.1 | 42.7 | 19.3 | 14.6 | 9.7 |
| SVA | 47 | 14.7 | 7.6 | 51.7 | 18.2 | 13.0 | 9.1 | ||
| SVA | 46 | 12.1 | 6.7 | 55.4 | 15.0 | 10.2 | 8.1 | ||
| 300L | SVA | 50 | 16.7 | 5.5 | 32.9 | 23.8 | 20.4 | 11.1 | |
| SVA | 52 | 17.1 | 6.4 | 37.4 | 27.0 | 20.5 | 12.9 | ||
| SVA | 46 | 14.1 | 6.0 | 42.5 | 20.5 | 16.6 | 10.3 | ||
| P600 | NOR | 42 | 17.6 | 7.2 | 40.9 | 22.4 | 18.5 | 11.6 | |
| NOR | 43 | 18.6 | 9.9 | 53.2 | 18.5 | 12.5 | 9.1 | ||
| NOR | 43 | 17.6 | 8.9 | 50.6 | 20.3 | 14.5 | 10.2 | ||
| Dense | NT | SVA | 48 | 18.6 | 10.5 | 56.4 | 16.7 | 9.7 | 7.7 |
| SVA | 47 | 15.9 | 8.5 | 53.5 | 14.1 | 9.5 | 6.9 | ||
| SVA | 46 | 17.0 | 9.0 | 52.9 | 16.2 | 10.5 | 8.1 | ||
| NP | KUL | 69 | 20.7 | 13.9 | 67.1 | 19.6 | 13.2 | 11.4 | |
| KUL | 64 | 18.2 | 12.5 | 68.7 | 15.2 | 8.0 | 7.9 | ||
| KUL | 65 | 19.2 | 12.3 | 64.1 | 18.5 | 9.6 | 8.5 | ||
| Sparse | 3 M | ÅSE | 36 | 13.9 | 5.7 | 41.0 | 17.5 | 14.1 | 8.6 |
| ÅSE | 37 | 15.2 | 5.8 | 38.2 | 22.2 | 16.5 | 9.8 | ||
| ÅSE | 38 | 14.5 | 6.7 | 46.2 | 18.1 | 13.1 | 9.9 | ||
| 10M | ÅHE | 43 | 15.2 | 3.5 | 23.0 | 29.3 | 26.6 | 10.8 | |
| ÅHE | 43 | 12.9 | 4.5 | 34.9 | 22.0 | 14.2 | 7.7 | ||
| ÅHE | 45 | 13.9 | 4.2 | 30.2 | 27.0 | 20.5 | 10.0 | ||
| Table 3. Effects of treatments and regimes on transition ages between different fibre length classes at different tree heights, as shown by analysis of variance. | ||||||
| Variable | Treatment | Regime | ||||
| df | F | P | df | F | P | |
| Breast height | ||||||
| Age at 1.5 mm | 6 | 3.15 | 0.036 | 2 | 5.13 | 0.017 |
| Age at 2.5 mm | 6 | 1.81 | 0.169 | 2 | 3.27 | 0.062 |
| Mean fibre length | 6 | 2.05 | 0.126 | 2 | 4.53 | 0.025 |
| 20% of tree height | ||||||
| Age at 1.5 mm | 6 | 2.14 | 0.112 | 2 | 6.49 | 0.008 |
| Age at 2.5 mm | 6 | 5.33 | 0.005 | 2 | 19.02 | 0.000 |
| Mean fibre length | 6 | 3.14 | 0.036 | 2 | 11.29 | 0.001 |
| 70% of tree height | ||||||
| Age at 1.5 mm | 6 | 0.47 | 0.817 | 2 | 0.38 | 0.690 |
| Age at 2.5 mm | 6 | 0.62 | 0.711 | 2 | 0.65 | 0.536 |
| Mean fibre length | 6 | 2.72 | 0.058 | 2 | 5.38 | 0.015 |
| Table 4. Number of year rings and mean ring width within different fibre length classes at breast height (BRH) and 20% of total tree height of the treatments examined. Different letters indicate significant differences. 300L = thinning leaving the 300 largest trees ha–1; 300S = thinning leaving the 300 smallest trees ha–1; P600 = PCT to 600 stems ha–1 at a dominant height of 5m; NT = no thinning; NP = no PCT; 3M = 3 m spacing; 10M = 10 m spacing. | ||||||
| Treatment | 0.3–1.5 mm | 1.5–2.5 mm | > 2.5 mm | |||
| No of years | Ring width (mm year–1) | No of years | Ring width (mm year–1) | Ring width (mm year–1) | ||
| BRH | ||||||
| 300L | 5.16ab | 2.98a | 14.30a | 3.21a | 1.60a | |
| 300S | 5.35ab | 2.48a | 15.20a | 1.99a | 1.53ab | |
| P600 | 4.47b | 2.62a | 12.59a | 2.99a | 1.51ab | |
| NT | 5.40ab | 2.29a | 11.68a | 2.22a | 1.05ab | |
| NP | 7.08ab | 3.21a | 13.40a | 1.74a | 0.73b | |
| 3M | 6.75ab | 3.16a | 14.96a | 2.98a | 1.30ab | |
| 10M | 10.81a | 3.63a | 17.38a | 2.86a | 1.40ab | |
| 20% | ||||||
| 300L | 4.42a | 3.56a | 11.35ab | 3.64a | 1.80a | |
| 300S | 4.03a | 3.78a | 11.36ab | 2.22b | 1.44ab | |
| P600 | 5.45a | 3.01a | 11.62ab | 3.23ab | 1.42ab | |
| NT | 4.60a | 3.56a | 8.28b | 2.45ab | 1.14ab | |
| NP | 4.58a | 3.46a | 8.85b | 2.46ab | 0.82b | |
| 3M | 7.05a | 3.72a | 14.64ab | 2.83ab | 1.26ab | |
| 10M | 6.82a | 3.57a | 15.72a | 3.75a | 1.46ab | |
| Table 5. Number of year rings and mean ring width within different fibre length classes at breast height (BRH) and 20% of total tree height of the regime types examined. Different letter indicate significant differences. Dense/Sparse = a high initial stand density followed by high intensity pre-commercial thinning/commercial thinning, Dense = a continuous high stand density and Sparse = a continuous low stand density. | ||||||
| Regime type | 0.3–1.5 mm | 1.5–2.5 mm | > 2.5 mm | |||
| No of years | Ring width (mm year–1) | No of years | Ring width (mm year–1) | Ring width (mm year–1) | ||
| BRH | ||||||
| Dense | 6.24ab | 2.75a | 12.54a | 1.98b | 0.89b | |
| Dense/Sparse | 4.99b | 2.69a | 14.03a | 2.73ab | 1.54a | |
| Sparse | 8.78a | 3.40a | 16.17a | 2.92a | 1.35a | |
| 20% | ||||||
| Dense | 4.59b | 3.51a | 8.56c | 2.46a | 0.98b | |
| Dense/Sparse | 4.63b | 3.45a | 11.44b | 3.03a | 1.55a | |
| Sparse | 6.94a | 3.64a | 15.18a | 2.29a | 1.36a | |
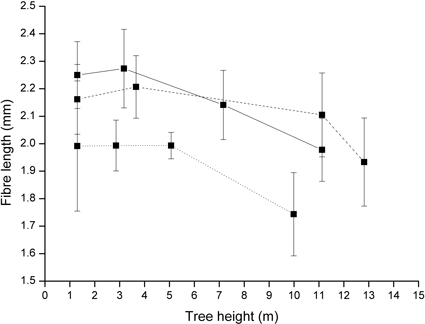
Fig. 1. Mean fibre length at the sample heights of the management regimes examined. Solid line represents Dense/Sparse (= a high initial stand density followed by high intensity pre-commercial thinning/commercial thinning), dashed line represents Dense (= a continuous high stand stem density) and dotted line denote Sparse (= a continuous low stand stem density); bars denote standard deviations.
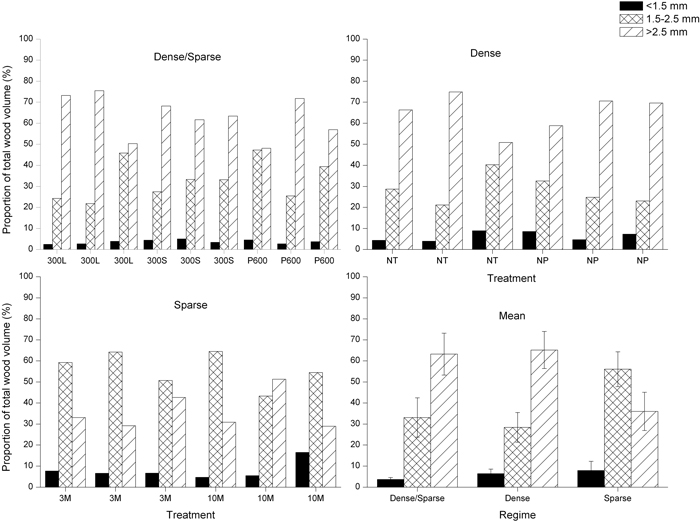
Fig. 2. Volume proportions of different fibre length intervals in all trees examined in each regime and mean values for the different principal management regimes (Dense/Sparse = a high initial stand density followed by high intensity pre-commercial thinning/commercial thinning, Dense = a continuous high stand stem density and Sparse = a continuous low stand stem density); bars denote standard deviations. 300L = thinning leaving the 300 largest trees ha–1; 300S = thinning leaving the 300 smallest trees ha–1; P600 = PCT to 600 stems ha–1 at a dominant height of 5 m; NT = no thinning; NP = no PCT; 3M = 3 m spacing; 10M = 10 m spacing.
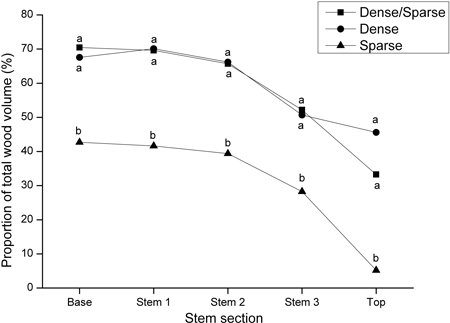
Fig. 3. Proportions of wood with fibres longer than 2.5 mm in relation to the total wood volume in five investigated stem sections from the base to the top of sample trees (Base = 0 to 1.3 m; Stem 1 = 1.3 m to 20% of total tree height; Stem 2 = 20% of total tree height to the height of the living crown; Stem 3 = height of the living crown to 70% of total tree height; Top = 70% of total tree height to 100% of total tree height). Different letters indicate significant differences between silvicultural regimes (Dense/Sparse = a high initial stand density followed by high intensity pre-commercial thinning/commercial thinning, Dense = a continuous high stand stem density and Sparse = a continuous low stand stem density). Squares denote Dense/Sparse regime, circles represent Dense regime and triangles show Sparse regime.
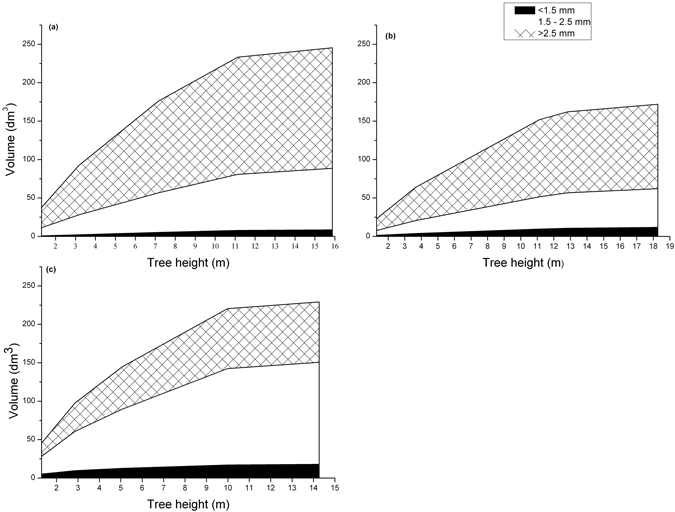
Fig. 4. Development of mean tree volume and wood volume by fibre length class with tree height in silvicultural management regimes with a high initial stand density followed by high intensity pre-commercial thinning/commercial thinning (a), a continuous high stand stem density (b) and a continuous low stand stem density (c).