| Table 1. Summary of the two modelling data sets. hL = Lorey’s mean height, dg = mean diameter by basal area, G = basal area, V = volume. | ||||||
| Ordinary sample plots | ALS-assisted plots | |||||
| Min. | Max. | Mean | Min. | Max. | Mean | |
| Young forest (forest stratum I) | (n = 72) | (n = 59) | ||||
| hL (m) | 6.8 | 22.5 | 12.9 | 6.0 | 21.3 | 13.7 |
| dg (cm) | 6.9 | 24.4 | 12.8 | 5.1 | 26.2 | 14.2 |
| G (m2 ha–1) | 3.5 | 44.3 | 20.5 | 1.4 | 42.8 | 21.4 |
| V (m3 ha–1) | 18.4 | 440.8 | 140.2 | 4.4 | 374.8 | 155.0 |
| Spruce (%) | 0 | 100 | 61 | 0 | 100 | 57 |
| Pine (%) | 0 | 100 | 28 | 0 | 100 | 29 |
| Deciduous (%) | 0 | 69 | 11 | 0 | 70 | 13 |
| Mature spruce forest, poor site quality (forest stratum II) | (n = 59) | (n = 59) | ||||
| hL (m) | 8.1 | 23.1 | 15.9 | 7.8 | 22.2 | 16.4 |
| dg (cm) | 9.8 | 36.5 | 16.9 | 10.0 | 30.3 | 16.9 |
| G (m2 ha–1) | 8.4 | 48.4 | 27.1 | 2.9 | 49.5 | 28.1 |
| V (m3 ha–1) | 40.4 | 460.5 | 211.2 | 13.4 | 420.2 | 230.3 |
| Spruce (%) | 0 | 100 | 64 | 0 | 98 | 21 |
| Pine (%) | 0 | 100 | 26 | 0 | 51 | 10 |
| Deciduous (%) | 0 | 64 | 11 | 5 | 13 | 9 |
| Mature spruce forest, good site quality (forest stratum III) | (n = 58) | (n = 58) | ||||
| hL (m) | 10.0 | 26.5 | 18.6 | 11.4 | 34.5 | 19.9 |
| dg (cm) | 10.0 | 31.5 | 18.9 | 9.5 | 27.6 | 18.5 |
| G (m2 ha–1) | 6.0 | 47.9 | 28.1 | 9.9 | 66.7 | 33.8 |
| V (m3 ha–1) | 32.1 | 579.2 | 262.5 | 77.4 | 692.4 | 332.8 |
| Spruce (%) | 1 | 100 | 78 | 9 | 100 | 77 |
| Pine (%) | 0 | 87 | 13 | 0 | 90 | 12 |
| Deciduous (%) | 0 | 99 | 9 | 0 | 54 | 12 |
| Mature pine forest (forest stratum IV) | (n = 75) | (n = 59) | ||||
| hL (m) | 8.6 | 24.4 | 16.3 | 10.0 | 22.9 | 16.9 |
| dg (cm) | 9.9 | 30.6 | 18.0 | 10.3 | 30.6 | 19.1 |
| G (m2 ha–1) | 7.3 | 54.6 | 24.0 | 3.4 | 46.9 | 22.3 |
| V (m3 ha–1) | 39.1 | 584.1 | 196.3 | 21.4 | 426.9 | 186.0 |
| Spruce (%) | 0 | 100 | 26 | 0 | 99 | 28 |
| Pine (%) | 0 | 100 | 68 | 0 | 100 | 65 |
| Deciduous (%) | 0 | 40 | 6 | 0 | 56 | 7 |
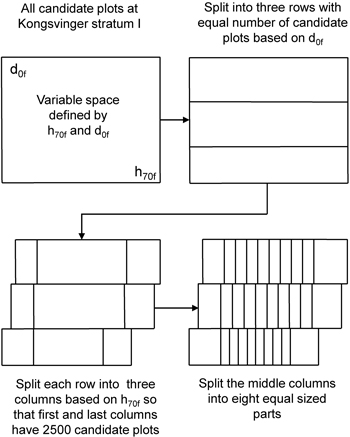
Fig. 1. Visualization of the stratification of candidate plots based on the two ALS variables.
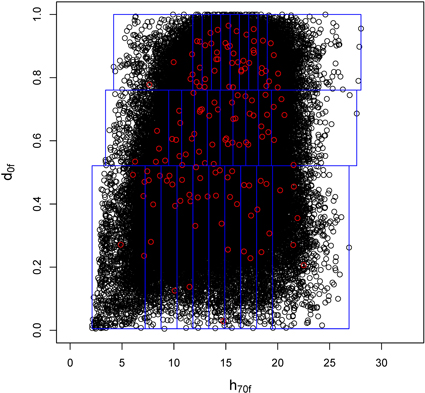
Fig. 2. Example of the use of two laser variables for plot selection in the municipality of Konsvinger in forest stratum IV. The plot shows the five pre-selected candidate plots in each ALS stratum defined by d0f and h70f.
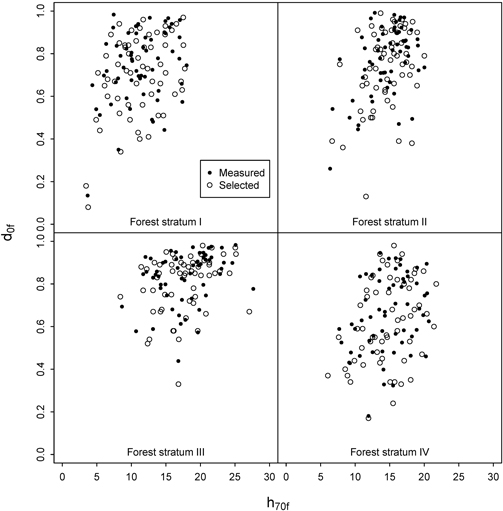
Fig. 3. Distribution of h70f and d0f at the intended sample plots and the plots actually measured in the field for the ALS-assisted data set.
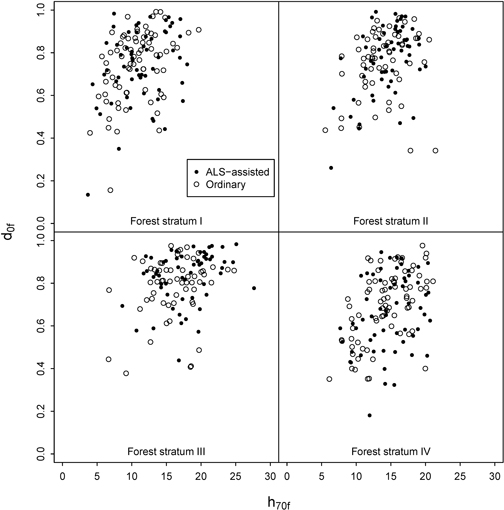
Fig. 4. Distribution of h70f and d0f at the ALS-assisted and ordinary sample plots.
| Table 2. Summary of the validation data set. hL = Lorey’s mean height, dg = mean diameter by basal area, G = basal area, V = volume. | |||
| Min | Max | Mean | |
| Young forest (forest stratum I) | (n = 19) | ||
| hL (m) | 10.1 | 19.3 | 13.2 |
| dg (cm) | 7.5 | 22.0 | 12.7 |
| G (m2 ha–1) | 6.6 | 35.5 | 20.5 |
| V (m3 ha–1) | 36.1 | 328.1 | 144.6 |
| Spruce (%) | 0 | 99 | 69 |
| Pine (%) | 0 | 100 | 26 |
| Deciduous (%) | 0 | 19 | 5 |
| Mature spruce forest, poor site quality (forest stratum II) | (n = 20) | ||
| hL (m) | 12.0 | 24.8 | 17.9 |
| dg (cm) | 10.2 | 27.1 | 17.5 |
| G (m2 ha–1) | 12.5 | 36.3 | 26.7 |
| V (m3 ha–1) | 82.2 | 389.5 | 236.4 |
| Spruce (%) | 22 | 100 | 76 |
| Pine (%) | 0 | 64 | 15 |
| Deciduous (%) | 0 | 38 | 9 |
| Mature spruce forest, good site quality (forest stratum III) | (n = 20) | ||
| hL (m) | 16.4 | 29.2 | 20.7 |
| dg (cm) | 14.0 | 27.9 | 18.6 |
| G (m2 ha–1) | 18.9 | 49.6 | 34.3 |
| V (m3 ha–1) | 156.2 | 565.0 | 347.1 |
| Spruce (%) | 15 | 100 | 81 |
| Pine (%) | 0 | 82 | 14 |
| Deciduous (%) | 0 | 20 | 6 |
| Mature pine forest (forest stratum IV) | (n = 19) | ||
| hL (m) | 13.8 | 21.6 | 17.0 |
| dg (cm) | 11.6 | 24.3 | 17.4 |
| G (m2 ha–1) | 11.6 | 33.9 | 22.6 |
| V (m3 ha–1) | 80.6 | 323.3 | 188.2 |
| Spruce (%) | 0 | 84 | 25 |
| Pine (%) | 15 | 100 | 74 |
| Deciduous (%) | 0 | 8 | 2 |
| Table 3. Predictors selected to each model and their RMSE and R2 in the model data. | |||||||||||
| n | OLS predictors | OLS RMSE (%) | OLS R2 | PLS latent components | PLS RMSE (%) | PLS R2 | |||||
| Young forest (forest stratum I) | |||||||||||
| ALS-assisted plots | 59 | d6f | h90l | d1l | 15.9 | 0.93 | 3 | 18.2 | 0.91 | ||
| Ordinary plots | 72 | hmeanf | d4f | d1l | d9l | 16.0 | 0.92 | 3 | 15.9 | 0.93 | |
| Spruce forest at low fertility sites (forest stratum II) | |||||||||||
| ALS-assisted plots | 59 | h40f | h70f | d4f | h0l | 13.9 | 0.89 | 3 | 14.7 | 0.88 | |
| Ordinary plots | 59 | hcvf | h30f | d3f | d9f | h10l | 14.4 | 0.90 | 3 | 16.0 | 0.87 |
| Spruce forest at high fertility sites (forest stratum III) | |||||||||||
| ALS-assisted plots | 58 | hmeanf | d0f | 14.3 | 0.89 | 3 | 15.6 | 0.87 | |||
| Ordinary plots | 58 | hmeanl | d1l | d5l | 16.7 | 0.88 | 4 | 17.5 | 0.87 | ||
| Pine forest (forest stratum IV) | |||||||||||
| ALS-assisted plots | 59 | d9f | h50l | d2l | d8l | 14.1 | 0.92 | 4 | 13.9 | 0.92 | |
| Ordinary plots | 75 | hmeanf | d0f | d7l | 21.4 | 0.84 | 4 | 19.9 | 0.86 | ||
| Table 4. Relative RMSE and D between the reference and predicted volume in a cross-comparison test. | |||||||||
| Method | Stratum | Laser-assisted model, ordinary plots | Ordinary model, laser-assisted plots | ||||||
| n | Mean volume | RMSE% | D% | n | Mean volume | RMSE% | D% | ||
| OLS | I | 72 | 140.2 | 17.9 | 3.5 | 59 | 155.0 | 16.7 | 2.5 |
| II | 59 | 211.2 | 21.5 | 3.1 | 59 | 230.3 | 22.5 | 1.7 | |
| III | 58 | 262.5 | 18.5 | 0.6 | 58 | 332.8 | 17.1 | 2.9 | |
| IV | 75 | 196.3 | 27.3 | 2.0 | 59 | 186.0 | 20.9 | 5.8* | |
| PLS | I | 72 | 140.2 | 18.8 | –4.4* | 59 | 155.0 | 18.7 | 4.9* |
| II | 59 | 211.2 | 20.6 | 1.2 | 59 | 230.3 | 18.9 | –2.0 | |
| III | 58 | 262.5 | 18.4 | –0.1 | 58 | 332.8 | 16.7 | 3.5 | |
| IV | 75 | 196.3 | 25.0 | 3.7 | 59 | 186.0 | 23.7 | –4.0 | |
| *Mean difference statistically significant at p = 0.05 | |||||||||
| Table 5. Relative RMSE and D between the reference and predicted volume in the validation plots. | |||||||
| Method | Stratum | n | Mean volume | Laser-assisted model | Ordinary model | ||
| RMSE% | D% | RMSE% | D% | ||||
| OLS | I | 19 | 144.6 | 15.3 | 2.7 | 15.1 | 4.9 |
| II | 20 | 236.4 | 14.0 | 1.6 | 15.6 | 4.3 | |
| III | 20 | 347.1 | 15.7 | 8.4* | 16.9 | 10.4* | |
| IV | 19 | 188.2 | 17.3 | 1.7 | 17.0 | 2.9 | |
| PLS | I | 19 | 144.6 | 15.3 | 1.7 | 16.3 | 5.6 |
| II | 20 | 236.4 | 14.3 | 2.6 | 13.8 | 0.4 | |
| III | 20 | 347.1 | 15.8 | 6.8 | 17.2 | 9.9* | |
| IV | 19 | 188.2 | 18.2 | 3.1 | 16.8 | 2.1 | |
| *Mean difference statistically significant at p = 0.05 | |||||||
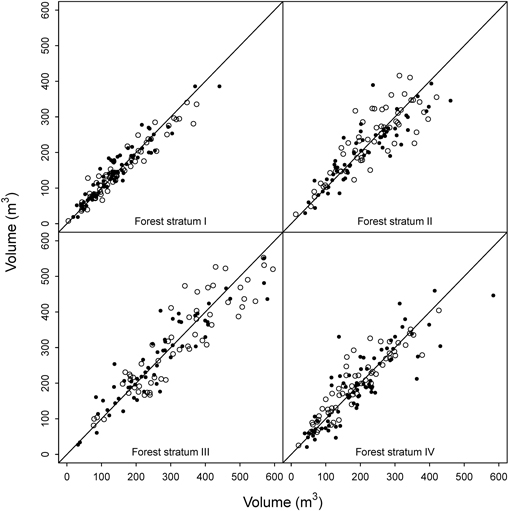
Fig. 5. Cross-comparison of the OLS models. Black = predictions for ordinary plots using the ALS-assisted model, white = prediction for ALS-assisted plots using ordinary model.
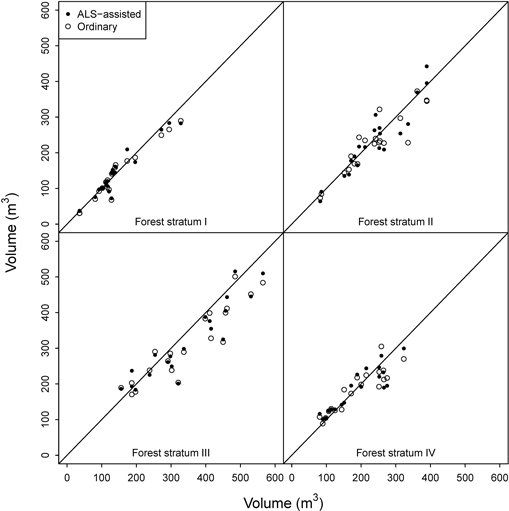
Fig. 6. OLS model predictions for the validation plots.
| Table 6. Results of reducing the number of plots by sub-sampling. The RMSE and D are PLS averages after 300 iterations. | |||||||||
| n | Forest stratum I | Forest stratum II | Forest stratum III | Forest stratum IV | |||||
| RMSE (%) | D (%) | RMSE (%) | D (%) | RMSE (%) | D (%) | RMSE (%) | D (%) | ||
| ALS-assisted | All | 15.3 | 1.7 | 14.3 | 2.6 | 15.8 | 6.8 | 18.2 | 3.1 |
| 50 | 15.3 | 1.6 | 14.9 | 2.3 | 16.0 | 6.4 | 18.1 | 2.6 | |
| 40 | 16.0 | 2.2 | 15.0 | 1.7 | 16.7 | 5.8 | 18.1 | 2.0 | |
| 30 | 15.9 | 2.1 | 16.2 | 1.3 | 17.0 | 6.2 | 18.7 | 2.4 | |
| 20 | 16.6 | 3.4 | 17.2 | 1.3 | 18.6 | 5.8 | 19.7 | 1.5 | |
| 15 | 17.1 | 2.9 | 17.5 | 1.2 | 19.2 | 6.0 | 20.0 | 1.6 | |
| Ordinary | All | 16.3 | 5.6 | 13.8 | 0.4 | 17.2 | 9.9 | 16.8 | 2.1 |
| 50 | 16.6 | 5.0 | 14.0 | 0.1 | 17.0 | 9.3 | 17.7 | 2.0 | |
| 40 | 17.2 | 5.4 | 14.8 | –0.5 | 17.1 | 8.9 | 18.4 | 1.4 | |
| 30 | 17.5 | 5.1 | 15.5 | –0.2 | 18.4 | 9.3 | 19.1 | 0.8 | |
| 20 | 18.3 | 6.0 | 16.6 | 0.3 | 19.5 | 9.0 | 21.0 | –0.4 | |
| 15 | 20.7 | 5.9 | 18.4 | 0.3 | 21.1 | 9.1 | 22.6 | –0.4 | |