| Table 1. Characteristics of study sites and mean values of basic sample trees attributes. |
| Lp. | Site | Location | Soil types | Age [yrs] | dbh [mm] | h [m] | BGB [kg/tree] |
| 1 | Dobieszyn1 | 51°35ʹN, 21°10ʹE | Podzols & luvisols | 2 | 0.2 | 1.03 | 0.015 |
| 2 | Dobieszyn1 | 51°35ʹN, 21°10ʹE | Podzols & luvisols | 5 | 7.0 | 2.20 | 0.027 |
| 3 | Dobieszyn1 | 51°35ʹN, 21°10ʹE | Podzols & luvisols | 9 | 28.2 | 4.97 | 0.499 |
| 4 | Dobieszyn1 | 51°35ʹN, 21°10ʹE | Podzols & luvisols | 13 | 58.2 | 8.61 | 1.771 |
| 5 | Dobieszyn2 | 51°33ʹN, 21°09ʹE | Podzols & luvisols | 4 | 0.0 | 0.64 | 0.003 |
| 6 | Dobieszyn2 | 51°33ʹN, 21°09ʹE | Podzols & luvisols | 6 | 13.9 | 3.26 | 0.073 |
| 7 | Dobieszyn2 | 51°33ʹN, 21°09ʹE | Podzols & luvisols | 7 | 29.1 | 5.15 | 0.241 |
| 8 | Dobieszyn2 | 51°33ʹN, 21°09ʹE | Podzols & luvisols | 12 | 64.1 | 10.24 | 2.141 |
| 9 | Kozienice | 51°24ʹN, 21°26ʹE | Podzols & luvisols | 4 | 0.0 | 0.73 | 0.004 |
| 10 | Kozienice | 51°24ʹN, 21°26ʹE | Podzols & luvisols | 3 | 20.6 | 3.10 | 0.322 |
| 11 | Kozienice | 51°24ʹN, 21°26ʹE | Podzols & luvisols | 12 | 36.8 | 5.95 | 0.326 |
| 12 | Kozienice | 51°24ʹN, 21°26ʹE | Podzols & luvisols | 13 | 56.3 | 9.33 | 1.038 |
| 13 | KPN1 | 52°21ʹN, 20°43ʹE | Luvisols & cambisols | 3 | 0.0 | 0.44 | 0.002 |
| 14 | KPN1 | 52°21ʹN, 20°43ʹE | Luvisols & cambisols | 6 | 16.7 | 3.64 | 0.093 |
| 15 | KPN1 | 52°21ʹN, 20°43ʹE | Luvisols & cambisols | 11 | 35.1 | 5.75 | 0.533 |
| 16 | KPN1 | 52°21ʹN, 20°43ʹE | Luvisols & cambisols | 12 | 60.9 | 8.30 | 1.510 |
| 17 | KPN2 | 52°20ʹN, 20°41ʹE | Luvisols & cambisols | 4 | 1.0 | 1.37 | 0.014 |
| 18 | KPN2 | 52°19ʹN, 20°40ʹE | Luvisols & cambisols | 5 | 16.0 | 3.08 | 0.110 |
| 19 | KPN2 | 52°19ʹN, 20°39ʹE | Luvisols & cambisols | 7 | 25.5 | 4.98 | 0.181 |
| 20 | KPN2 | 52°19ʹN, 20°39ʹE | Luvisols & cambisols | 12 | 46.2 | 8.28 | 0.556 |
| Table 2. Basic descriptive statistics of coarse roots biomass (BGB) and root-to-shoot (R/S) ratio for analysed young birches growing on post-agricultural lands in central Poland (n = 181). |
| | min | m | me | max | sd | cv |
| BGB [kg/tree] | 0.0007 | 0.4226 | 0.1234 | 4.3055 | 0.7829 | 185 |
| R/S | 0.091 | 0.245 | 0.193 | 1.015 | 0.154 | 63 |
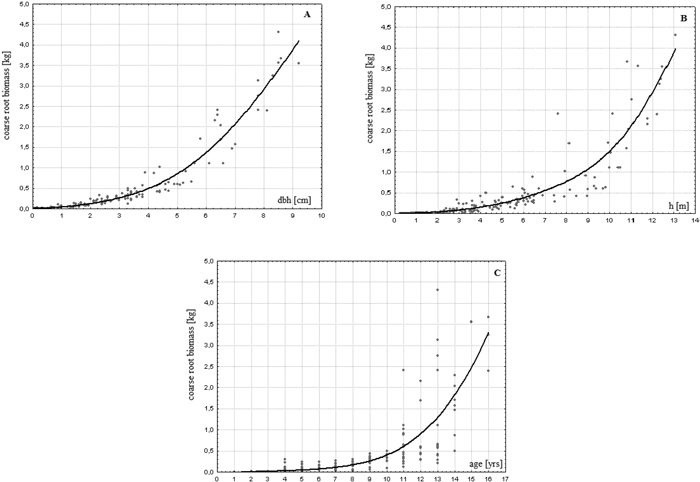
Fig. 1. Relationship between coarse root biomass and dbh (A), height (B) and age (C) of a tree in young successional silver birch stands on post-agricultural lands in central Poland
| Table 3. Goodness-of-fit measures for analysed allometric equations. |
| Eq. | R2 | RMSE | MSE | m PEall | sd PEall | cv PEall | m PEnd0 | sd PEnd0 | cv PEnd0 |
| 1 | 0.943 | 0.188 | 0.002 | 202 | 546 | 270 | 31 | 267 | 854 |
| 2 | 0.943 | 0.189 | 0.016 | –40 | 50 | 123 | –22 | 43 | 191 |
| 3 | 0.849 | 0.308 | 0.039 | –39 | 56 | 141 | –23 | 54 | 231 |
| 4 | 0.938 | 0.197 | 0.024 | –44 | 49 | 113 | –27 | 44 | 164 |
| 5 | 0.939 | 0.195 | 0.002 | 321 | 833 | 259 | 54 | 406 | 751 |
| 6 | 0.929 | 0.211 | 0.002 | 390 | 997 | 256 | 68 | 486 | 715 |
| 7 | 0.943 | 0.189 | 0.011 | 4 | 52 | 1201 | –6 | 35 | 558 |
| 8 | 0.943 | 0.188 | 0.001 | 108 | 247 | 229 | 23 | 109 | 466 |
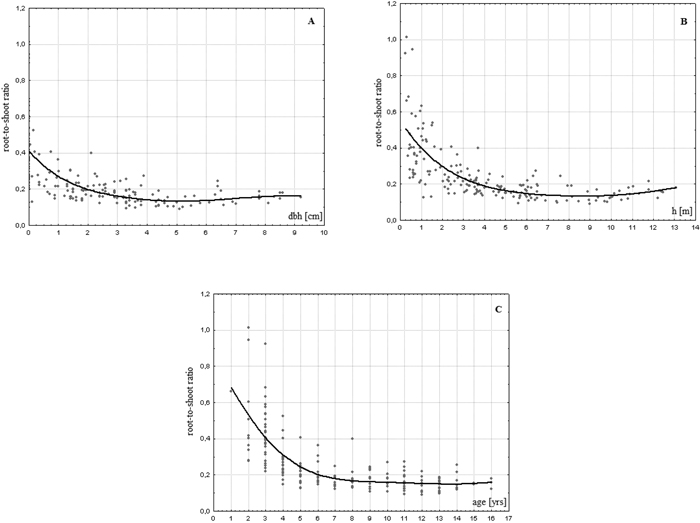
Fig. 2. Relationship between R/S ratio values and dbh (A), height (B) and age (C) of a tree in young successional silver birch stands on post-agricultural lands in central Poland.