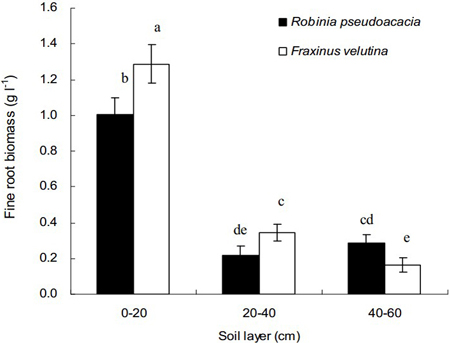
Fig. 1. Vertical distributions of fine root biomass of Robinia pseudoacacia and Fraxinus velutina in the mixed planted forest at different depths of the saline soil. Each vertical bar represents the average of three sampling plots for each tree species. The error bars represent the standard deviation. Bars with different letters are significantly different at p < 0.05 by the least significant difference test.
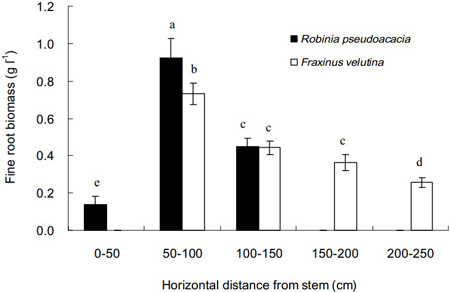
Fig. 2. Horizontal distributions of fine root biomass of Robinia pseudoacacia and Fraxinus velutina in the mixed planted forest at different distances from stem in the saline soil. Each vertical bar represents the average of three sampling plots for each tree species. The error bars represent the standard deviation. Bars with different letters are significantly different at p < 0.05 by the least significant difference test.
| Table 1. Fine root morphological parameters of black locust and velvet ash. | ||||
| Tree species | Specific root length (m g–1) | Specific root area (cm2 g–1) | Specific root volume (cm3 g–1) | Average diameter (mm) |
| Black locust | 7.08 b a) | 99.92 b | 5.11 b | 0.51 a |
| Velvet ash | 8.91 a | 116.30 a | 7.21 a | 0.55 a |
| a) Different letters in a same column mean significant difference at p < 0.05 level. | ||||
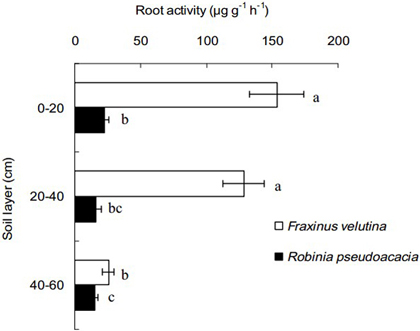
Fig. 3. Fine root activity of Robinia pseudoacacia and Fraxinus velutina in the mixed planted forest within 50–100 cm distance from stem in the saline soil. The value of fine root activity was expressed as the amount of 2,3,5-triphenyl tetrazolium chloride reduced per gram of root fresh mass per hour (µg g–1 h–1). Each horizontal bar represents the average of three sampling plots for each tree species. The error bars represent the standard deviation. Bars with different letters are significantly different at p < 0.05 by the least significant difference test.
| Table 2. Soil properties in the mixed planted forest of black locust and velvet ash. | |||||||
| Soil layer (cm) | Soil sample type | pH | Soluble salt (g kg–1) | Organic matter (g kg–1) | Available N (mg kg–1) | Available P (mg kg–1) | Available K (mg kg–1) |
| 0–20 | Control a) | 8.51 a b) | 0.79 c | 16.2 c | 75.39 c | 3.95 b | 92.6 c |
| BRS | 8.27 b | 0.85 b | 21.1 b | 98.34 a | 4.15 b | 113.5 b | |
| VRS | 8.13 c | 0.92 a | 27.5 a | 86.39 b | 5.71 a | 140.3 a | |
| 20–40 | Control | 8.61 a | 0.95 b | 10.8 c | 54.18 c | 3.16 c | 80.6 b |
| BRS | 8.32 b | 0.96 b | 15.8 b | 75.41 a | 3.76 b | 86.4 b | |
| VRS | 8.20 c | 1.34 a | 16.5 a | 64.88 b | 4.74 a | 105.3 a | |
| 40–60 | Control | 8.76 a | 1.63 c | 8.3 c | 36.64 c | 2.67 c | 56.8 b |
| BRS | 8.46 b | 1.76 b | 13.3 b | 55.36 a | 4.15 b | 63.5 a | |
| VRS | 8.22 c | 2.01 a | 14.3 a | 53.28 a | 4.93 a | 66.4 a | |
| a) Control – non-rhizosphere soil, BRS – rhizosphere soil of black locust, VRS – rhizosphere soil of velvet ash. b) Different letters in a same soil layer mean significant difference at p < 0.05 level. | |||||||