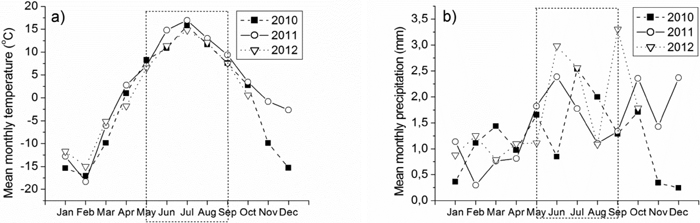
Fig. 1. a) Mean monthly temperature (°C) and b) mean monthly precipitation (mm) in Rovaniemi during 2010–2012. Weather data for November and December are not available in 2012. Growing season is represented by rectangles in the figures.
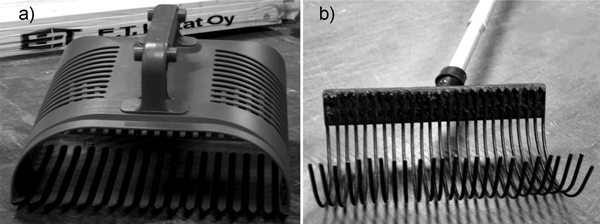
Fig. 2. Picture of a) the plastic hand rake and b) long-handed metal rake used in the experiment. The width of the plastic hand rake was 21.5 cm with flat, pointed, gradually widening plastic tines. The space between the tines was 1 cm at the point and 0.5 cm at the base of the tines. The width of the metal rake was 20 cm and had evenly distributed round (diameter 2.5 mm) metal tines, located 0.5 cm apart.
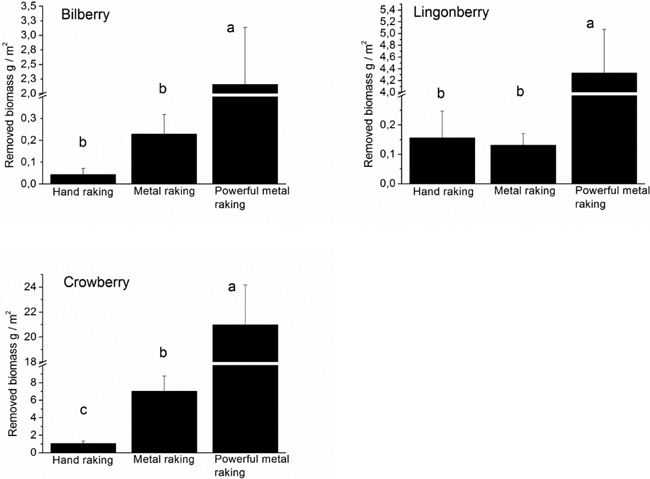
Fig. 3. The amount of the biomass of bilberry, lingonberry and crowberry (dry weight g/m2, mean ± SE) which was removed from the picking treatment plots by rakes in 2010. Different legends indicate significant differences between the treatments as revealed by the one-factor ANOVA followed by Tukey’s post hoc-test at the significance level p < 0.05.
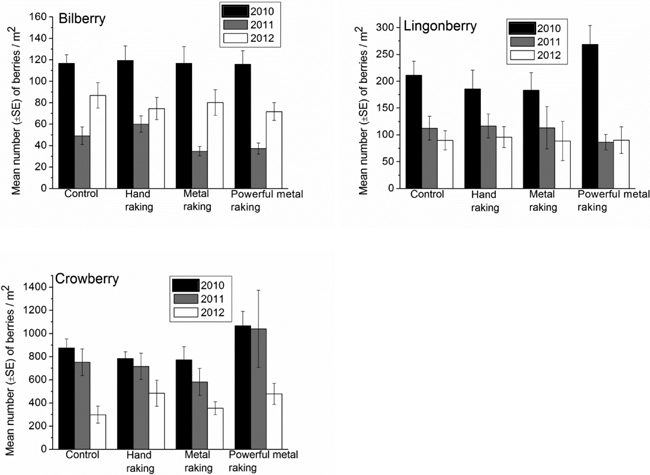
Fig. 4. Mean number of berries (± SE)/m2 of bilberry, lingonberry and crowberry in the control and the picking treatment plots during 2010–2012.
| Table 1. Results of the repeated measures ANOVA analyzing the effect of picking treatment on the number of the berries of bilberry, lingonberry and crowberry during 2010–2012. Picking treatment and year df = 3 and 2, respectively, and error df = 28 and 56, respectively. Year x picking treatment df = 6. | ||||||
| Year | Picking | Year x Picking | ||||
| F | p | F | p | F | p | |
| Bilberry | 79.080 | < 0.001 | 0.384 | 0.766 | 0.835 | 0.548 |
| Lingonberry | 43.517 | < 0.001 | 0.139 | 0.936 | 1.947 | 0.089 |
| Crowberry a) | 14.957 | < 0.001 | 2.179 | 0.113 | 0.528 | 0.753 |
| a) Huynh-Feldt adjusted F values were used in the analysis. | ||||||
| Table 2. Results of the repeated measures ANOVA analyzing the difference between picking treatments on the fresh weight of the berries of bilberry, lingonberry and crowberry in 2010 and 2012. Picking treatment and year df = 2 and 1, respectively, and error df = 21 and 21, respectively. Year x picking treatment df = 2. | ||||||
| Year | Picking | Year x Picking | ||||
| F | p | F | p | F | p | |
| Bilberry | 115.271 | < 0.001 | 1.017 | 0.379 | 2.893 | 0.078 |
| Lingonberry | 297.142 | < 0.001 | 0.854 | 0.440 | 2.374 | 0.118 |
| Crowberry | 5.428 | 0.030 | 0.162 | 0.851 | 0.349 | 0.710 |
| Table 3. Pooled fresh weight of the berries (g/m2) and mean fresh weight of the berry in treatment plots in 2010 and 2012. | ||||||
| Bilberry | Lingonberry | Crowberry | ||||
| Mean ± SE | Mean ± SE | Mean ± SE | ||||
| Pooled fresh weight | Fresh weight of the berry | Pooled fresh weight | Fresh weight of the berry | Pooled fresh weight | Fresh weight of the berry | |
| 2010 | ||||||
| Control | not measured | not measured | not measured | not measured | not measured | not measured |
| Hand rake | 37.32 ± 4.6 | 0.31 ± 0.01 | 49.38 ± 7.5 | 0.27 ± 0.01 | 222.21 ± 20.8 | 0.28 ± 0.01 |
| Metal rake | 31.25 ± 4.7 | 0.21 ± 0.01 | 52.01 ± 8.3 | 0.28 ± 0.01 | 212.24 ± 31.1 | 0.27 ± 0.01 |
| Powerful metal rake | 32.31 ± 5.6 | 0.27 ± 0.02 | 68.93 ± 7.5 | 0.27 ± 0.01 | 287.94 ± 25.6 | 0.28 ± 0.01 |
| 2012 | ||||||
| Control | 16.45 ± 3.3 | 0.17 ± 0.02 | 18.37 ± 3.1 | 0.21 ± 0.00 | 91.00 ± 24.3 | 0.30 ± 0.03 |
| Hand rake | 13.38 ± 2.5 | 0.17 ± 0.02 | 20.19 ± 4.0 | 0.21 ± 0.00 | 122.66 ± 26.8 | 0.26 ± 0.02 |
| Metal rake | 14.70 ± 2.5 | 0.18 ± 0.01 | 17.57 ± 6.6 | 0.20 ± 0.01 | 91.76 ± 16.6 | 0.25 ± 0.01 |
| Powerful metal rake | 13.28 ± 2.4 | 0.18 ± 0.01 | 17.21 ± 4.8 | 0.19 ± 0.01 | 128.46 ± 25.9 | 0.27 ± 0.01 |