| Table 1. Location and climatic characteristics of the four black spruce stands listed at increasing latitudes of the boreal forest of Quebec, Canada. Climatic data are based on weather measurements covering the period 2002–2010. | |||||||
| Site | Latitude | Longitude | Altitude (m a.s.l.) | Mean temperature | Extreme annual temperature | ||
| Annual (°C) | May-September (°C) | Maximum (°C) | Minimum (°C) | ||||
| SIM | 48°13´N | 71°15´W | 338 | 2.0 | 13.3 | 35.7 | –39.7 |
| BER | 48°51´N | 70°20´W | 611 | 0.3 | 11.4 | 33.1 | –39.8 |
| MIS | 49°43´N | 71°56´W | 342 | 1.0 | 12.7 | 35.1 | –42.4 |
| DAN | 50°41´N | 72°11´W | 487 | –0.9 | 11.0 | 34.2 | –47.1 |
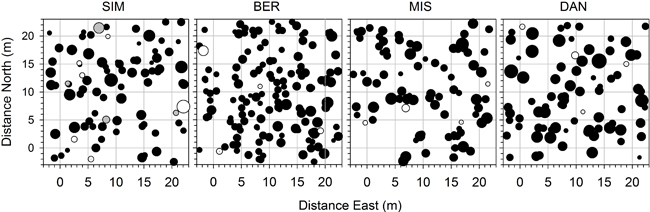
Fig. 1. Locations of the trees at plot establishment in 2000 in the four permanent plots in the boreal forest of Quebec, Canada. Black spruce, balsam fir and white birch are indicated with black, white and grey circles, respectively. Symbol size is proportional to DBH. In each plot, 25 fixed points were assessed at the nodes of the grid represented by the grey lines. Only the individuals located within the plot of 20×20 m were used to assess the stand characteristics.
| Table 2. Stand characteristics measured at plot establishment in 2000. | |||||||
| Stand | Number of trees in the plot | Dominant height (m) | Mean DBH (cm) | Stand density (trees ha–1) | Stand basal area (m2 ha–1) | ||
| Black spruce | Balsam fir | White birch | |||||
| SIM | 46 | 4 | 2 | 20.2 | 16.7 | 1300 | 30.1 |
| BER | 84 | 2 | 0 | 20.0 | 15.8 | 2150 | 43.5 |
| MIS | 56 | 2 | 0 | 19.2 | 17.3 | 1450 | 36.2 |
| DAN | 52 | 3 | 0 | 18.0 | 19.4 | 1375 | 43.4 |
| Table 3. Characteristics of the saplings mapped at plot establishment in 2000. | ||||||
| Stand | Number of saplings in the plot | Height (m) | Mean DBH (cm) | Density (saplings ha–1) | ||
| Black spruce | Balsam fir | White birch | ||||
| SIM | 8 | 4 | 2 | 5.9 | 6.6 | 350 |
| BER | 4 | 1 | 0 | 6.8 | 6.8 | 125 |
| MIS | 9 | 2 | 0 | 5.0 | 5.9 | 275 |
| DAN | 3 | 4 | 0 | 5.9 | 6.4 | 175 |
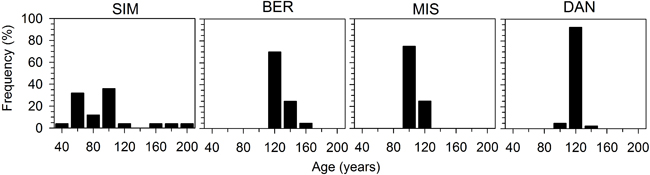
Fig. 2. Frequency distribution of age measured at plot establishment in the four black spruce stands in the boreal forest of Quebec, Canada. Ages represent individuals harvested in sample plots located close to the four permanent plots.
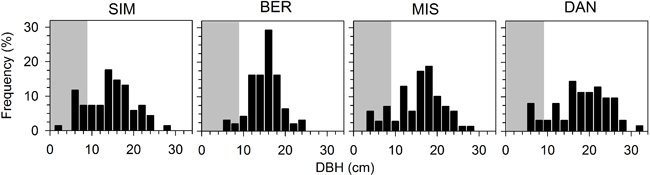
Fig. 3. Frequency distribution of diameter at breast height (DBH) in the four black spruce stands in the boreal forest of Quebec, Canada. Grey background indicates the individuals considered as saplings.
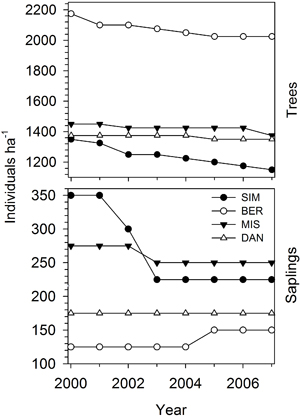
Fig. 4. Variation in the number of trees and saplings during the period 2000–2007 in the four permanent plots of black spruce in the boreal forest of Quebec, Canada.
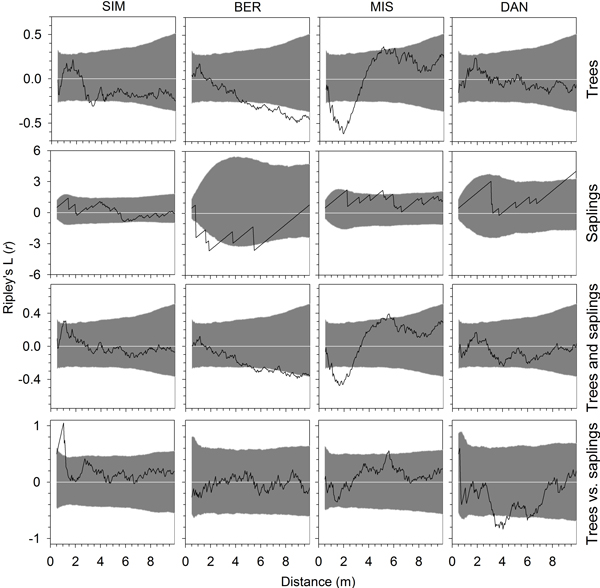
Fig. 5. Univariate and bivariate Ripley’s L(r) functions calculated for the year 2000, at plot establishment, for trees, saplings, all individuals and for trees versus saplings in the four permanent plots of black spruce in the boreal forest of Quebec, Canada. Grey areas represent the 95% confidence envelopes based on Monte Carlo simulations. Values of the functions greater or lower than this envelope indicate a pattern significantly different from randomness and a tendency to overdispersion (segregation) or aggregation (clustering) of individuals, respectively.
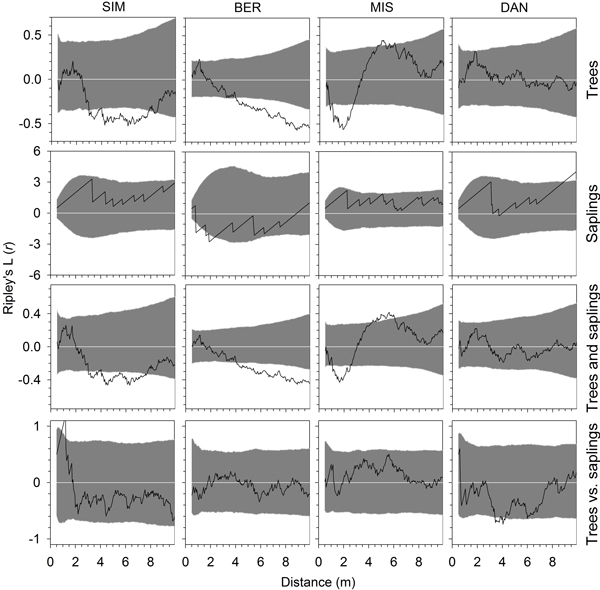
Fig. 6. Univariate and bivariate Ripley’s L(r) functions calculated for the year 2007, at the end of the monitoring period, for trees, saplings, all individuals and for trees versus saplings in the four permanent plots of black spruce in the boreal forest of Quebec, Canada. Grey areas represent the 95% confidence envelopes based on Monte Carlo simulations. Values of the functions greater or lower than this envelope indicate a pattern significantly different from randomness and a tendency to overdispersion (segregation) or aggregation (clustering) of individuals, respectively.