| Table 1. Classification and site characteristics of the sample stands (PCT = Pre-Commercial Thinning, OMT = Oxalis-Myrtillus type, MT = Myrtillus type, VT = Vaccinium type). |
| Attribute | No previous PCT done | PCT has been previously done |
| Pine | Spruce | Hardwood | Pine | Spruce | Hardwood |
| Regeneration method |
| Planting | 30 | 176 | 31 | 19 | 46 | 13 |
| Sowing or natural regeneration | 34 | 16 | 14 | 15 | 15 | 14 |
| Undefined | 6 | 6 | 6 | 1 | 4 | 2 |
| Site type |
| OMT | 0 | 67 | 11 | 0 | 11 | 7 |
| MT | 38 | 118 | 40 | 17 | 48 | 22 |
| VT | 32 | 13 | 0 | 18 | 6 | 0 |
| Soil texture |
| Mineral soil | 66 | 189 | 46 | 28 | 63 | 25 |
| Peatland | 4 | 9 | 5 | 7 | 2 | 4 |
| Soil preparation method |
| Continuous trace | 27 | 104 | 26 | 15 | 27 | 18 |
| Ploughing | 7 | 25 | 3 | 0 | 5 | 1 |
| Disc-trenching | 20 | 79 | 23 | 15 | 22 | 17 |
| Spots | 27 | 85 | 19 | 15 | 27 | 4 |
| Mounding with ditching | 11 | 41 | 6 | 10 | 14 | 3 |
| Spot- or invert mounding | 2 | 17 | 5 | 2 | 6 | 0 |
| Patching | 14 | 27 | 8 | 3 | 7 | 1 |
| Not prepared | 16 | 9 | 6 | 5 | 11 | 7 |
| Total | 70 | 198 | 51 | 35 | 65 | 29 |
| Table 2. Characteristics of the sample stands treated as continuous variables (PCT = Pre-Commercial Thinning). |
| Dataset | General stand characteristics | Young stand management |
| Area, ha | Stand age, years | Density, trees ha–1 | Height, m | Removal, stumps ha–1 | Stump
diameter, cm | Labour consumption,
days ha–1 |
| No previous PCT done |
| Scots pine (N 70) |
| Mean | 2.1 | 12.1 | 2231 | 4.2 | 12 308 | 2.5 | 1.6 |
| SD | 1.8 | 3.9 | 538 | 1.9 | 8204 | 1.1 | 1.3 |
| Min | 0.3 | 6.0 | 960 | 1.4 | 1400 | 0.7 | 0.4 |
| Max | 9 | 20.0 | 3840 | 9.0 | 39 800 | 7.3 | 8.9 |
| Norway spruce (N 198) |
| Mean | 2.4 | 10.7 | 2019 | 3.2 | 13 877 | 2.8 | 2.0 |
| SD | 2.0 | 3.2 | 495 | 1.2 | 7959 | 1.1 | 1.4 |
| Min | 0.2 | 4.0 | 1000 | 1.1 | 2000 | 0.7 | 0.4 |
| Max | 11.9 | 20.0 | 5520 | 7.1 | 58 400 | 6.5 | 9.6 |
| Hardwood (N 51) |
| Mean | 1.6 | 11.1 | 1973 | 5.2 | 12 682 | 2.4 | 1.5 |
| SD | 1.2 | 3.6 | 491 | 1.5 | 8386 | 0.8 | 0.8 |
| Min | 0.2 | 6.0 | 1200 | 3.1 | 1000 | 0.6 | 0.4 |
| Max | 5.4 | 20.0 | 3240 | 9.8 | 46 200 | 4.2 | 4.2 |
| PCT has been previously done |
| Scots pine (N 35) |
| Mean | 2.0 | 13.6 | 2402 | 4.7 | 11 091 | 2.1 | 1.2 |
| SD | 1.5 | 3.2 | 551 | 1.4 | 5032 | 0.6 | 0.4 |
| Min | 0.3 | 8.0 | 960 | 2.4 | 5200 | 1.0 | 0.6 |
| Max | 6.1 | 20.0 | 3440 | 7.1 | 32 200 | 3.5 | 2.4 |
| Norway spruce (N 65) |
| Mean | 1.7 | 11.9 | 2250 | 4.3 | 11 465 | 2.3 | 1.3 |
| SD | 1.2 | 3.3 | 636 | 1.6 | 6646 | 0.8 | 0.6 |
| Min | 0.2 | 7.0 | 1080 | 1.7 | 1800 | 1.2 | 0.4 |
| Max | 5.2 | 20.0 | 4280 | 9.0 | 45 200 | 6.2 | 3.9 |
| Hardwood (N 29) |
| Mean | 1.7 | 13.3 | 2167 | 6.8 | 10 766 | 2.3 | 1.2 |
| SD | 1.7 | 3.0 | 591 | 2.0 | 4490 | 0.6 | 0.4 |
| Min | 0.1 | 8.0 | 1200 | 2.2 | 3200 | 1.3 | 0.5 |
| Max | 6.7 | 20.0 | 3320 | 10.2 | 23 600 | 3.3 | 2.0 |
| Table 3. Fixed effects of the mixed linear regression model for Labour Consumption of Pre-Commercial Thinning (PCT) on stands without previous PCT. The dependent variable is Ln(LCNPCT) and all denominators had 308 df. |
| Source | Numerator df | F | Sig. |
| Intercept | 1 | 26.116 | 0.000 |
| Dominant tree species | 2 | 2.053 | 0.130 |
| Stand age | 1 | 41.735 | 0.000 |
| Stand age * Main tree species | 2 | 3.066 | 0.048 |
| Site type | 2 | 25.845 | 0.000 |
| Soil preparation method | 2 | 9.955 | 0.000 |
| Ln(Area) | 1 | 15.349 | 0.000 |
| Table 4. Mixed linear regression model for Labour Consumption of Pre-Commercial Thinning (PCT) on stands without previous PCT. The dependent variable is Ln(LCNPCT) in days ha–1, the random stand and plot level effects are uj (Var = 0.379^2) and eij (Var = 0.542^2), all variables had 308 df, and the model fit is 47.6%. OMT = Oxalis-Myrtillus type, MT = Myrtillus type, VT = Vaccinium type. |
| Parameter | Estimate | Std. error | t | Sig. | 95% confidence interval |
| Lower bound | Upper bound |
| Intercept | –0.9762 | 0.2300 | –4.245 | 0.0000 | –1.4288 | –0.5237 |
| Dominant tree species (Ref. Hardwood) |
| Scots pine | 0.0140 | 0.2794 | 0.050 | 0.9600 | –0.5357 | 0.5638 |
| Norway spruce | –0.3550 | 0.2389 | –1.486 | 0.1384 | –0.8251 | 0.1152 |
| Stand age | 0.0321 | 0.0179 | 1.797 | 0.0733 | –0.0031 | 0.0673 |
| Stand age * Scots pine | 0.0184 | 0.0227 | 0.809 | 0.4189 | –0.0263 | 0.0630 |
| Stand age * Norway spruce | 0.0471 | 0.0208 | 2.267 | 0.0241 | 0.0062 | 0.0880 |
| Stand age * Hardwoods | 0.0000 | 0.0000 | | | | |
| Site type (Ref. VT) |
| OMT | 0.7613 | 0.1059 | 7.189 | 0.0000 | 0.5529 | 0.9696 |
| MT | 0.5059 | 0.0885 | 5.719 | 0.0000 | 0.3318 | 0.6799 |
| Soil preparation method (Ref. not prepared) | | | | |
| Continuous trace | 0.1067 | 0.0965 | 1.106 | 0.2697 | –0.0831 | 0.2965 |
| Spots | 0.3163 | 0.0967 | 3.271 | 0.0012 | 0.1260 | 0.5066 |
| Ln(Area), ha | 0.1359 | 0.0347 | 3.918 | 0.0001 | 0.0677 | 0.2042 |
| Variance components [Stand (uj), Plot (eij)] |
| Var(uj) | 0.1436 | 0.0165 | | 0.000 | 0.2715 | 0.3171 |
| Var(eij) | 0.2934 | 0.0116 | | 0.000 | 0.1147 | 0.1797 |
| Table 5. Mixed linear regression model for Labour Consumption of Pre-Commercial Thinning (PCT) on stands with previous PCT. The dependent variable is Ln(LCPCT) in days ha–1, and the random stand and plot level effects are uj (Var = 0.265^2) and eij (Var = 0.504^2), and the model fit is 6.7%. |
| Parameter | Estimate | Std. error | df | t | Sig. | 95% confidence interval |
| Lower bound | Upper bound |
| Intercept | –0.2905 | 0.0942 | 207 | –3.085 | 0.002 | –0.476 | –0.105 |
| Stand age, years | 0.0249 | 0.0071 | 207 | 3.495 | 0.001 | 0.011 | 0.039 |
| Variance components [Stand (uj), Plot (eij)] |
| Var(uj) | 0.0706 | 0.0122 | | | 0.000 | 0.050 | 0.099 |
| Var(eij) | 0.2539 | 0.0124 | | | 0.000 | 0.237 | 0.287 |
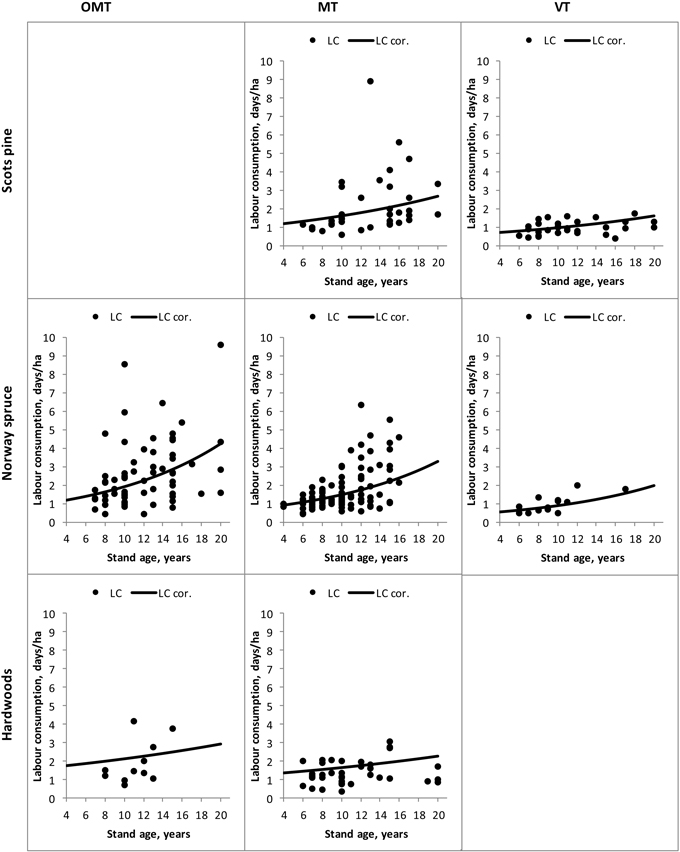
Fig. 1. The back-transformed and bias-corrected a priori estimates (LC cor.), and the calculated values (LC) of labour consumption of Pre-Cmmercial Thinning (PCT) according to site type (OMT = Oxalis-Myrtillus type, MT = Myrtillus type, VT = Vaccinium type), stand age, and removal in Scots pine, Norway spruce, and hardwood stands which have no previous PCT done. In the estimates, variables “area” and “soil preparation” were set to “2.2 ha” and “Continuous trace”, respectively.
| Table 6. Mixed linear regression model for stump diameter of the removed trees on stands which have not been previously pre-commercially thinned. The dependent variable is stump diameter in cm, the random stand and plot level effects are uj (Var = 0.674^2) and eij (Var = 1.110^2), all variables had 308 df, and the model fit is 45.6%. OMT = Oxalis-Myrtillus type, MT = Myrtillus type, VT = Vaccinium type. |
| Parameter | Estimate | Std. error | t | Sig. | 95% confidence interval |
| Lower bound | Upper bound |
| Intercept | 0.3356 | 0.4279 | 0.784 | 0.433 | –0.5063 | 1.1776 |
| Dominant tree species (Ref. Hardwood) |
| Scots pine | 0.5988 | 0.5198 | 1.1520 | 0.250 | –0.4240 | 1.6215 |
| Norway spruce | –0.1462 | 0.4446 | –0.329 | 0.742 | –1.0210 | 0.7285 |
| Stand age | 0.1148 | 0.0333 | 3.451 | 0.001 | 0.0494 | 0.1803 |
| Stand age * Scots pine | –0.0219 | 0.0422 | –0.519 | 0.604 | –0.1050 | 0.0612 |
| Stand age * Norway spruce | 0.0459 | 0.0387 | 1.186 | 0.236 | –0.0302 | 0.1220 |
| Stand age * Hardwoods | 0.0000 | 0.0000 | | | | |
| Site type (Ref. VT) |
| OMT | 1.0663 | 0.1970 | 5.412 | 0.000 | 0.6787 | 1.4540 |
| MT | 0.5469 | 0.1646 | 3.323 | 0.001 | 0.2231 | 0.8707 |
| Soil preparation method (Ref. not prepared) |
| Continuous trace | –0.0662 | 0.1795 | –0.3687 | 0.713 | –0.4193 | 0.2870 |
| Spots | 0.2550 | 0.1799 | 1.417 | 0.157 | –0.0991 | 0.6090 |
| Ln(Area), ha | 0.1487 | 0.0646 | 2.303 | 0.022 | 0.0217 | 0.2757 |
| Variance components [Stand (uj), Plot (eij)] |
| Var(uj) | 0.4536 | 0.0572 | | 0.000 | 0.3542 | 0.5809 |
| Var(eij) | 1.2323 | 0.0488 | | 0.000 | 1.1403 | 1.3317 |
| Table 7. Mixed linear regression model for density of the removed trees on stands which have not been previously pre-commercially thinned. The dependent variable is density of the trees removed ha–1, the random stand and plot level effects are uj (Var = 6569.5^2) and eij (Var = 8333.9^2) all variables had 308 df, and the model fit is 16.2%. |
| Parameter | Estimate | Std. error | t | Sig. | 95% confidence interval |
| Lower bound | Upper bound |
| Intercept | 2764.3 | 3862.7 | 0.716 | 0.475 | –4836.3 | 10364.9 |
| Dominant tree species (Ref. Hardwood) |
| Scots pine | –1717.5 | 4692.0 | –0.366 | 0.715 | –10949.9 | 7514.9 |
| Norway spruce | –2554.6 | 4013.0 | –0.637 | 0.525 | –10451.0 | 5341.8 |
| Stand age | 90.0 | 300.3 | 0.300 | 0.765 | –501.0 | 681.0 |
| Stand age * Scots pine | 313.3 | 381.3 | 0.822 | 0.412 | –437.0 | 1063.6 |
| Stand age * Norway spruce | 271.8 | 349.0 | 0.779 | 0.437 | –415.0 | 958.6 |
| Stand age * Hardwoods | 0.0 | 0.0 | | | | |
| Site type (Ref. VT) |
| OMT | 7109.7 | 1778.5 | 3.998 | 0.000 | 3610.1 | 10609.2 |
| MT | 5928.1 | 1485.6 | 3.990 | 0.000 | 3004.9 | 8851.4 |
| Soil preparation method (Ref. not prepared) |
| Continuous trace | 1784.0 | 1620.0 | 1.101 | 0.272 | –1403.6 | 4971.6 |
| Spots | 3784.2 | 1624.3 | 2.330 | 0.020 | 588.1 | 6980.3 |
| Ln(Area), ha | 2064.4 | 582.7 | 3.543 | 0.000 | 917.8 | 3210.9 |
| Variance components [Stand (uj), Plot (eij)] |
| Var(uj) | 43157746 | 4629589 | | 0.000 | 34974317 | 53255967 |
| Var(eij) | 69436790 | 2749029 | | 0.000 | 64252532 | 75039344 |
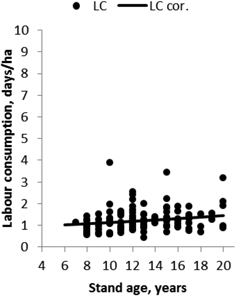
Fig. 2. The back-transformed and bias-corrected a priori estimates (LC cor.), and calculated values (LC) of labour consumption of Pre-Commercial Thinning (PCT) according to stand age and removal in stands which have previously had PCT.