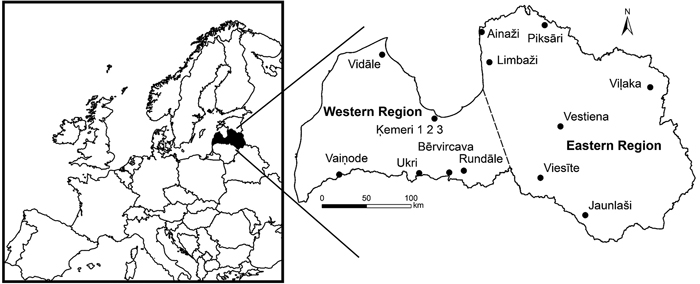
Fig. 1. Location of the studied permanent sampling plots. Broken line indicates arbitrarily division of Latvia in two regions with differing growth patterns of broadleaved trees.
| Table 1. Statistics of ash stands in Latvia according to data from Latvia State Forest Service and permanent sampling plots for the period 2005–2015. The 95% confidence intervals are shown for the permanent sampling plot data. | |||
| Year | |||
| 2005 | 2010 | 2015 | |
| Latvia State Forest Service data | |||
| Total stand area, ha | 18 315.7 | 16 263.5 | 13 673.71 |
| Total standing stock m3 | 373 7303 | 369 8663 | 341 0624 |
| Mean standing volume, m3 ha–1 | 204.05 | 227.42 | 249.43 |
| Permanent sampling plot data | |||
| Living | |||
| Stand density, individuals ha–1 | 256 ± 55 | 136 ± 45 | 77 ± 32 |
| Standing volume, m3 ha–1 | 322 ± 89 | 246 ± 77 | 151 ± 59 |
| Deadwood | |||
| Stand density, individuals ha–1 | 74 ± 50 | 178 ± 82 | 233 ± 79 |
| Standing volume, m3 ha–1 | 18 ± 14 | 119 ± 54 | 212 ± 66 |