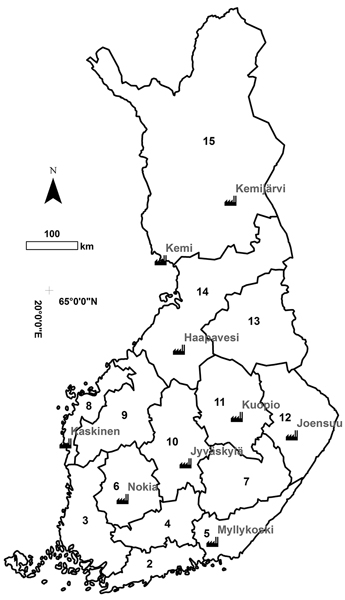
Fig. 1. The regional division in the study and the selected biorefinery locations. For the region names, see Table 3.
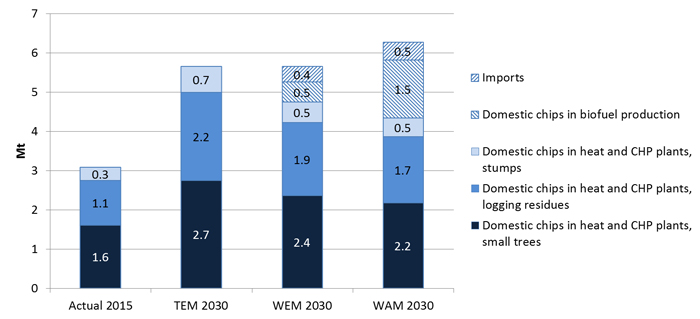
Fig. 2. The consumption of forest chips in heat and CHP plants realized in 2015 and in the demand scenarios for 2030 assessed in this study.
| Table 1. Assumed supply radius of a plant as a function of demand (Kurki et al. 2012). | |
| Demand (kt) | Supply radius (km) |
| ≤ 1.3 | 30 |
| ≤ 4.2 | 60 |
| ≤ 33.6 | 100 |
| ≤ 73.5 | 150 |
| > 73.5 | 200 |
| Table 2. The assumptions of the balance scenarios. Scenarios: “2015” – Actual demand of forest chips in 2015; “TEM” – estimate of demand in 2030 from the Ministry of Economic Affairs and Employment; “WEM” - estimate of demand in 2030 “With Existing Measures” from an impact analysis for the Finnish energy and climate strategy; “WAM” – estimate of demand in 2030 “With Additional Measures” from the impact analysis; “WAM+” – demand as in “WAM”, but potential of small trees higher; “WAM_Res100” – demand as in “WAM”, but only residues used in biorefining; “WAM_ST100” – demand as in “WAM”, but only small trees used in biorefining; “WAM_NS” – demand of stumps as in “WAM”, but only spruce stumps accepted. Potentials: “ST” – technical potential of small trees; “ST10.5” – technical potential of small trees with diameters below 10.5 cm at breast height; “ResBAU” – residue potential corresponding to realized harvesting level; “StuBAU” – stump potential corresponding to realized harvesting level; “ResMax” – residue potential corresponding to maximum sustainable removals; “StuMax” – stump potential corresponding to maximum sustainable removals. | |||
| Scenario | Biomass assortment(s) considered | Potential | Shares of small trees and residues of biorefinery feedstock |
| 2015 | all | ST10.5; ResBAU; StuBAU | N/A |
| TEM | all | ST10.5; ResMax; StuMax | N/A |
| WEM | all | ST10.5; ResMax; StuMax | 50%/50% |
| WAM | all | ST10.5; ResMax; StuMax | 50%/50% |
| WAM+ | small trees | ST | 50%/50% |
| WAM_Res100 | small trees, logging residues | ST10.5; ResMax | 0%/100% |
| WAM_ST100 | small trees, logging residues | ST10.5; ResMax | 100%/0% |
| WAM_NS | stumps | StuMax (spruce only) | N/A |
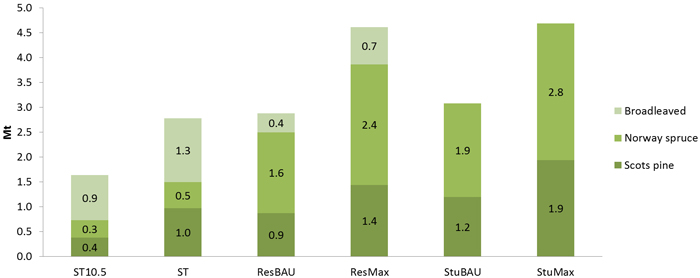
Fig. 3. Technical harvesting potential of forest chips in Finland.
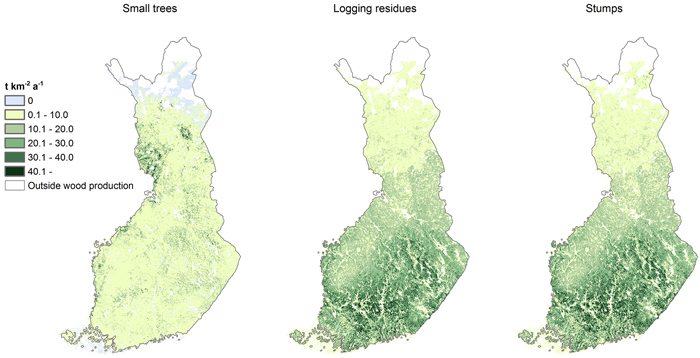
Fig. 4. Spatially explicit technical harvesting potentials of small trees (left), logging residues (centre), and stumps (right).
| Table 3. Technical harvesting potentials by region (1000 t). “ST” – technical potential of small trees; “ST10.5” – technical potential of small trees with diameters below 10.5 cm at breast height; “ResBAU” – residue potential corresponding to realized harvesting level; “StuBAU” – stump potential corresponding to realized harvesting level; “ResMax” – residue potential corresponding to maximum sustainable removals; “StuMax” – stump potential corresponding to maximum sustainable removals. | |||||||
| Region nr | Region | ST10.5 | ST | ResBAU | ResMax | StuBAU | StuMax |
| 1 | Åland | 3 | 6 | 16 | 24 | 18 | 24 |
| 2 | Uusimaa | 37 | 52 | 129 | 221 | 140 | 212 |
| 3 | Lounais-Suomi | 84 | 120 | 188 | 358 | 226 | 375 |
| 4 | Häme | 43 | 70 | 222 | 294 | 249 | 296 |
| 5 | Kaakkois-Suomi | 62 | 91 | 212 | 280 | 235 | 298 |
| 6 | Pirkanmaa | 68 | 104 | 198 | 323 | 220 | 331 |
| 7 | Etelä-Savo | 115 | 184 | 298 | 424 | 324 | 442 |
| 8 | Ostrobothnia | 55 | 86 | 64 | 144 | 69 | 141 |
| 9 | South and Central Ostrobothnia | 109 | 168 | 144 | 243 | 159 | 259 |
| 10 | Central Finland | 104 | 166 | 286 | 422 | 306 | 454 |
| 11 | Pohjois-Savo | 137 | 217 | 294 | 433 | 300 | 439 |
| 12 | North Karelia | 120 | 183 | 223 | 365 | 236 | 375 |
| 13 | Kainuu | 141 | 269 | 175 | 285 | 180 | 278 |
| 14 | North Ostrobothnia | 217 | 402 | 262 | 414 | 238 | 385 |
| 15 | Lapland | 343 | 658 | 163 | 382 | 176 | 381 |
| Total | 1638 | 2775 | 2874 | 4611 | 3077 | 4689 | |
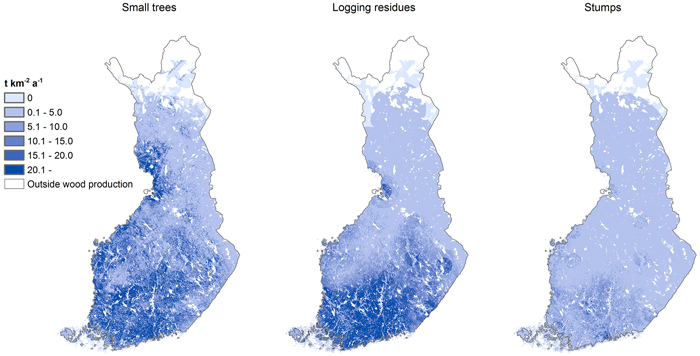
Fig. 5. Spatially explicit demand for small trees, logging residues, and stumps according to the scenario TEM in 2030.
| Table 4. Forest chip balance of small trees in the basic and sensitivity scenarios by region (1000 t). “2015” – Actual demand of forest chips in 2015; “TEM” – estimate of demand in 2030 from the Ministry of Economic Affairs and Employment; “WEM” – estimate of demand in 2030 “With Existing Measures” from an impact analysis for the Finnish energy and climate strategy; “WAM” – estimate of demand in 2030 “With Additional Measures” from the impact analysis; “WAM+” – demand as in “WAM”, but potential of small trees higher; “WAM_Res100” – demand as in “WAM”, but only residues used in biorefining; “WAM_ST100” – demand as in “WAM”, but only small trees used in biorefining. | ||||||||
| Region nr | Region | 2015 | TEM | WEM | WAM | WAM+ | WAM_Res100 | WAM_ST100 |
| 1 | Åland | -1 | -3 | -2 | -2 | 1 | -2 | -2 |
| 2 | Uusimaa | -85 | -188 | -147 | -136 | -113 | -132 | -141 |
| 3 | Lounais-Suomi | -56 | -245 | -202 | -179 | -132 | -168 | -191 |
| 4 | Häme | -70 | -153 | -134 | -119 | -100 | -110 | -128 |
| 5 | Kaakkois-Suomi | -7 | -60 | -53 | -45 | -13 | -31 | -59 |
| 6 | Pirkanmaa | -78 | -214 | -200 | -178 | -139 | -158 | -199 |
| 7 | Etelä-Savo | -24 | -95 | -81 | -68 | 0 | -48 | -87 |
| 8 | Ostrobothnia | -17 | -54 | -49 | -43 | -12 | -32 | -54 |
| 9 | South and Central Ostrobothnia | -37 | -124 | -111 | -99 | -32 | -80 | -118 |
| 10 | Central Finland | -60 | -146 | -139 | -119 | -56 | -95 | -142 |
| 11 | Pohjois-Savo | 31 | -27 | -36 | -25 | 57 | 3 | -53 |
| 12 | North Karelia | 51 | 12 | 4 | 11 | 78 | 33 | -10 |
| 13 | Kainuu | 100 | 70 | 78 | 58 | 185 | 84 | 32 |
| 14 | North Ostrobothnia | 74 | -36 | -23 | -144 | 49 | 27 | -316 |
| 15 | Lapland | 182 | 103 | 77 | -231 | 98 | 139 | -601 |
| Total | 1 | -1159 | -1019 | -1320 | -130 | -571 | -2069 | |
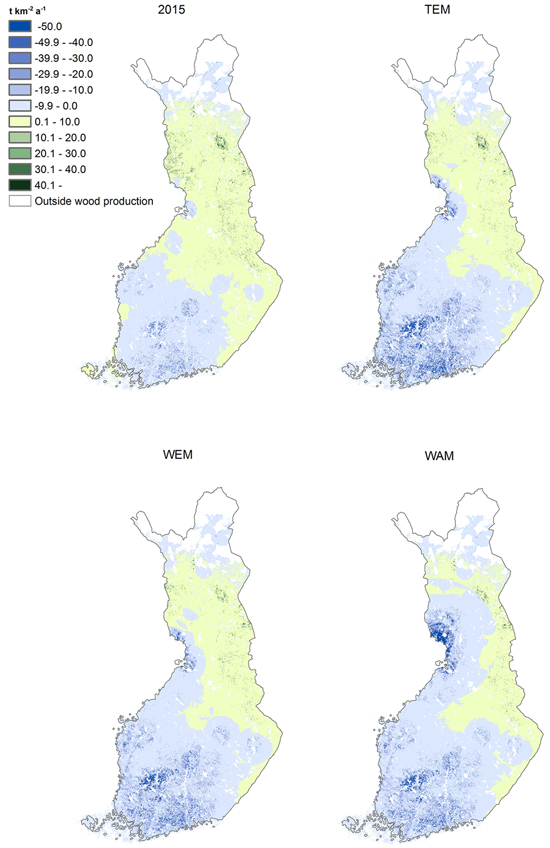
Fig. 6. Forest chip balance of small trees in 2015 and according to the scenarios TEM, WEM, and WAM.
| Table 5. Forest chip balance of logging residues in the basic and sensitivity scenarios by region (1000 t). “2015” – Actual demand of forest chips in 2015; “TEM” – estimate of demand in 2030 from the Ministry of Economic Affairs and Employment; “WEM” – estimate of demand in 2030 “With Existing Measures” from an impact analysis for the Finnish energy and climate strategy; “WAM” – estimate of demand in 2030 “With Additional Measures” from the impact analysis; “WAM_Res100” – demand as in “WAM”, but only residues used in biorefining; “WAM_ST100” – demand as in “WAM”, but only small trees used in biorefining. | |||||||
| Region nr | Region | 2015 | TEM | WEM | WAM | WAM_Res100 | WAM_ST100 |
| 1 | Åland | 7 | 11 | 13 | 14 | 14 | 14 |
| 2 | Uusimaa | 15 | -34 | 14 | 26 | 21 | 31 |
| 3 | Lounais-Suomi | 61 | 50 | 95 | 115 | 105 | 126 |
| 4 | Häme | 87 | 36 | 63 | 82 | 70 | 94 |
| 5 | Kaakkois-Suomi | 115 | 101 | 112 | 127 | 113 | 142 |
| 6 | Pirkanmaa | 98 | 103 | 111 | 127 | 106 | 148 |
| 7 | Etelä-Savo | 180 | 209 | 230 | 250 | 231 | 268 |
| 8 | Ostrobothnia | 27 | 83 | 84 | 87 | 75 | 98 |
| 9 | South and Central Ostrobothnia | 86 | 154 | 157 | 163 | 148 | 178 |
| 10 | Central Finland | 174 | 230 | 233 | 252 | 228 | 277 |
| 11 | Pohjois-Savo | 205 | 273 | 270 | 281 | 252 | 310 |
| 12 | North Karelia | 168 | 261 | 266 | 274 | 254 | 294 |
| 13 | Kainuu | 158 | 242 | 248 | 227 | 201 | 252 |
| 14 | North Ostrobothnia | 211 | 301 | 284 | 95 | -139 | 329 |
| 15 | Lapland | 153 | 350 | 316 | 53 | -254 | 361 |
| Total | 1746 | 2371 | 2496 | 2173 | 1425 | 2921 | |
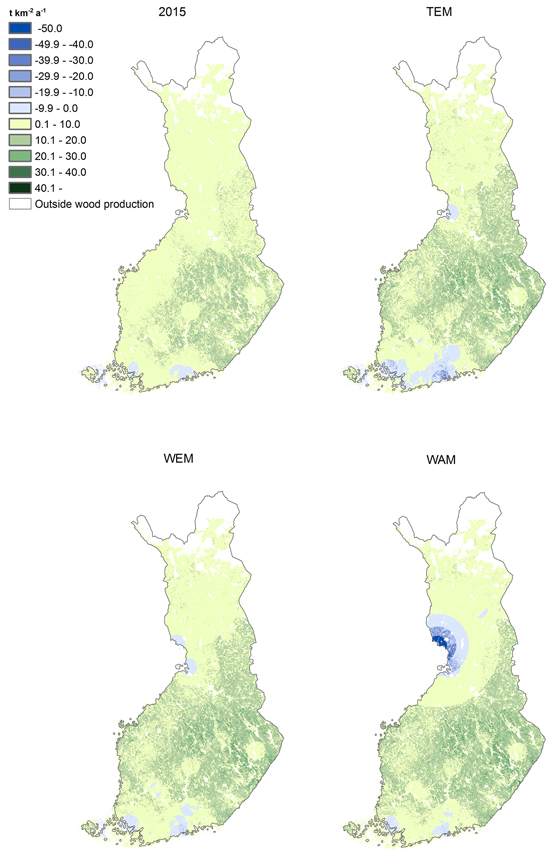
Fig. 7. Forest chip balance of logging residues in 2015 and according to the scenarios TEM, WEM, and WAM.
| Table 6. Forest chip balance of stumps in the basic and sensitivity scenarios by region (1000 t). “2015” – Actual demand of forest chips in 2015; “TEM” – estimate of demand in 2030 from the Ministry of Economic Affairs and Employment; “WEM” - estimate of demand in 2030 “With Existing Measures” from an impact analysis for the Finnish energy and climate strategy; “WAM” – estimate of demand in 2030 “With Additional Measures” from the impact analysis; “WAM_NS” – demand of stumps as in “WAM”, but only spruce stumps accepted. | ||||||
| Region nr | Region | 2015 | TEM | WEM | WAM | WAM_NS |
| 1 | Åland | 17 | 22 | 22 | 23 | 10 |
| 2 | Uusimaa | 120 | 157 | 176 | 179 | 126 |
| 3 | Lounais-Suomi | 191 | 291 | 314 | 319 | 185 |
| 4 | Häme | 209 | 235 | 248 | 252 | 197 |
| 5 | Kaakkois-Suomi | 200 | 248 | 257 | 262 | 163 |
| 6 | Pirkanmaa | 181 | 265 | 277 | 280 | 191 |
| 7 | Etelä-Savo | 286 | 395 | 404 | 411 | 265 |
| 8 | Ostrobothnia | 47 | 111 | 117 | 119 | 68 |
| 9 | South and Central Ostrobothnia | 122 | 210 | 218 | 223 | 83 |
| 10 | Central Finland | 265 | 387 | 398 | 407 | 250 |
| 11 | Pohjois-Savo | 271 | 403 | 412 | 414 | 292 |
| 12 | North Karelia | 218 | 345 | 350 | 352 | 178 |
| 13 | Kainuu | 159 | 252 | 256 | 255 | 80 |
| 14 | North Ostrobothnia | 207 | 345 | 351 | 355 | 112 |
| 15 | Lapland | 159 | 358 | 360 | 361 | 92 |
| Total | 2653 | 4023 | 4160 | 4213 | 2291 | |
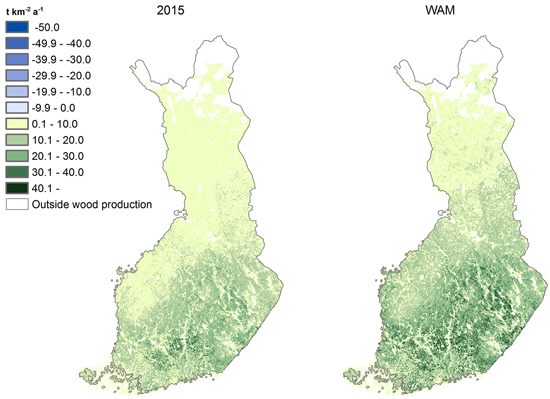
Fig. 8. Forest chip balance of stumps in 2015 and according to the scenario WAM. The maps of the scenarios TEM and WEM do not noticeably differ from the one of the scenario WAM and are, thus, not shown.