| Table 1. Studied stands, stumps and Heterobasidion infections. | |||
| Norway spruce | Scots pine | Significance a at α = 0.05 | |
| Stands and stumps | |||
| Stand age, years (min – max) | 11 – 39 | 10 – 15 | - |
| – mean ± SD | 24.4 ± 10.4 | 12.8 ± 1.4 | p = 0.04 |
| Number of investigated stumps | 746 | 1063 | - |
| Stump age at sampling, weeks (min – max) | 7 – 260 | 9 – 260 | - |
| – mean ± SD | 68.4 ± 91.6 | 67.8 ± 77.4 | p = 0.52 |
| Stump diameter, cm (min – max) | 2.1 – 12.1 | 1.5 – 11.7 | - |
| – mean ± SD | 6.1 ± 2.1 | 5.1 ± 1.8 | p > 0.05 |
| Heterobasidion infections | |||
| Number of infected stumps | 184 | 105 | - |
| Infection frequency, % of infected stumps (min – max) | 1.3 – 84.9 | 0.0 – 36.9 | - |
| – mean ± SD | 25 ± 3 | 10 ± 2 | p < 0.05 |
| Colonized stump surface area, cm2 (min – max) | 0.5 – 55.4 | 0.5 – 53.9 | - |
| – mean ± SD | 7.5 ± 8.4 | 4.1 ± 6.3 | p < 0.05 |
| Colonized stump surface area, % (min – max) | 0.4 – 68.9 | 0.8 – 81.1 | - |
| – mean ± SD | 21.7 ± 17.5 | 11.0 ± 11.5 | p < 0.05 |
| a difference between tree species | |||
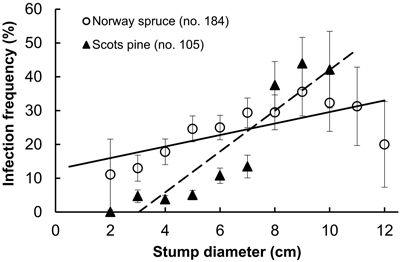
Fig. 1. Infection frequency by Heterobasidion to stumps of Norway spruce and Scots pine in relation to stump diameter; spruce: r = 0.71, (p = 0.02), y = 1.7x + 12.6; pine: r = 0.97 (p < 0.001), y = 6.0x–18.3 (dashed). Bars show standard error.
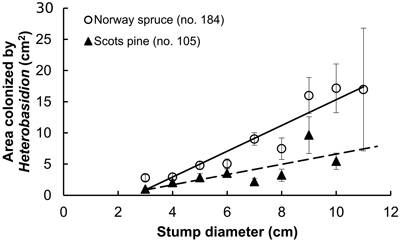
Fig. 2. Stump surface area colonized by Heterobasidion in relation to stump diameter; spruce: r = 0.46 (p < 0.001), y = 2.1x–5.4; pine: r = 0.33 (p < 0.001), y = 0.8x–1.6 (dashed). Bars show standard error.