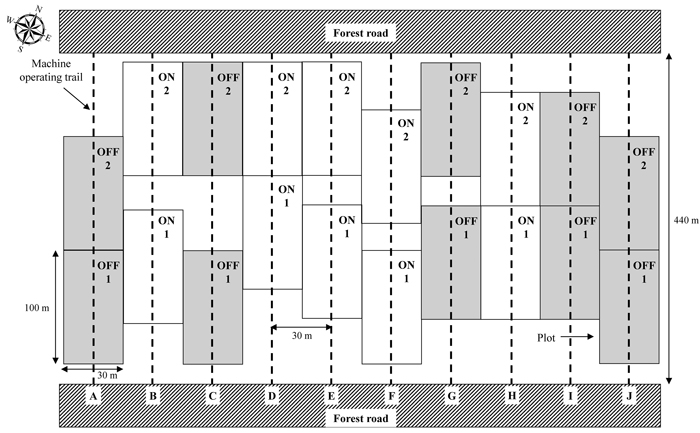
Fig. 1. Schematic of the study design indicating the location of machine operating trails and treatment plots. Grey shaded plots were subjected to quality bucking (OFF) whereas white plots were subjected to automatic bucking (ON).
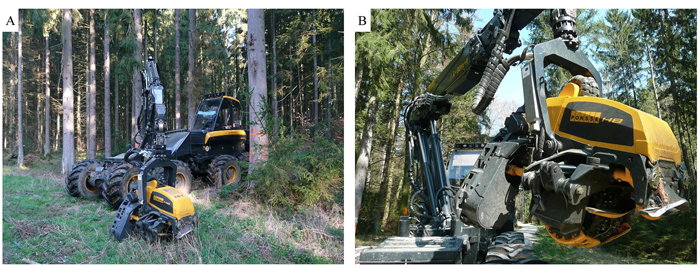
Fig. 2. A. Ponsse Bear single grip-harvester, B. Ponsse H8 harvesting head.
| Table 1. Harvesting machine specifications (Ponsse). | ||
| Dimensions | Minimal and usual weight | 23 800 kg; 24 500 kg |
| Engine | Engine output | 260 kW (350 hp) |
| Torque | 1400 Nm (1300–1600 rpm) | |
| Traction | 230 kN | |
| Boom C6 | Slewing torque (gross) | 67 kNm |
| Lifting moment (gross) | 310 kNm | |
| Reach | 10 m | |
| Harvesting head Ponsse H8 | Weight (depending on the equipment) | 1250 kg |
| Maximum felling diameter | 800 mm | |
| Feeding speed | 5 m/s | |
| Maximum opening of front and rear knives | 740 mm / 780 mm | |
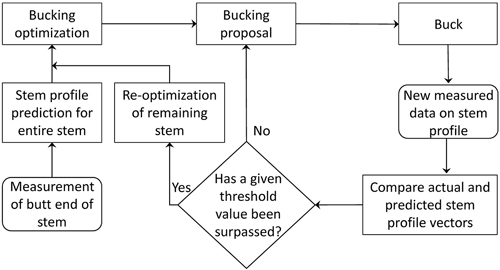
Fig. 3. Flowchart indicating the general steps of the bucking optimization proposal (Uusitalo 2010).
| Table 2. Assortments, diameters, and lengths used in the study along with a percentage based price-matrix where the products of highest value were set at 100%. | ||||||||||
| Assortments | Top diameter (without bark) [cm] | Length [m] | Diameter class (range in cm) | |||||||
| 1b | 2a | 2b | 3a | 3b | 4 | 5 | 6 | |||
| (15–19) | (20–24) | (25–29) | (30–34) | (35–39) | (40–49) | (50–59) | (60+) | |||
| Pulpwood | ≥ 10 | 2 + 3 | 68% | 68% | 68% | 68% | 68% | 68% | 68% | 68% |
| Low grade pulpwood | ≥ 7 | 2 + 3 | 44% | 44% | 44% | 44% | 44% | 44% | 44% | 44% |
| Pallet | ≥ 25 | 3.6 | 62% | 67% | 74% | 74% | 74% | 74% | 41% | 41% |
| Sawlog | ≥ 14 | 4 + 5 | 77% | 86% | 95% | 95% | 95% | 95% | 95% | 95% |
| Large diameter sawlog | ≥ 40 | 5 | - | - | - | - | - | 100% | 100% | 100% |
| Table 3. Description of work cycle elements. | ||
| Work cycle element | Start | End |
| Boom-out | Boom extending towards tree | Harvesting head positioned at base of tree or start of processing motor-manually felled trees |
| Felling | Head is in vertical position and saw is activated | Tree crown touches the ground or feed rollers are activated |
| Processing | Feed rollers are activated with stem in harvesting head | Tree-top is released |
| Manipulation1 | Other boom tasks | |
| Moving | Traction system is activated | Traction system is deactivated or other elements, e.g. Boom-out, Manipulation2 dominates |
| Delay3 | Tasks, which could not be allocated to another work cycle element | |
| 1 Movements of the boom, which cannot be allocated to the processing element: building a brush-mat, sorting/piling processed logs, etc. 2 Meaning: If the boom moves away from the vehicular-middle while the machine still continues moving, the task “Moving” ends in favor of the task “Boom-out”/”Manipulation”. 3 Interruptions which are not part of the pure working time: repairs, phone calls, influences due to the study, etc. Because of the chosen unit stating the productivity in PMH0, all delays were removed for analysis. | ||
| Table 4. Pre-harvest tree inventory data with sample size (number of trees harvested), dbh, height, standing volume per tree, and respective standard error by treatment. | |||||||||
| Treatment | Operating trail | N | dbh [cm] | Height [m] | Single-tree volume [m3 with bark] | ||||
| Average | SE | Average | SE | Average | SE | ||||
| OFF | A | 10 | 48.4 a1 | 3.42 | 35.5 a | 0.58 | 3.2 ab | 0.47 | |
| C | 50 | 48.9 a | 1.47 | 33.5 ab | 0.67 | 3.1 a | 0.17 | ||
| G | 45 | 45.2 a | 1.52 | 32.5 b | 0.55 | 2.6 ab | 0.19 | ||
| I | 41 | 43.9 a | 1.58 | 33.3 ab | 0.52 | 2.5 b | 0.18 | ||
| J | 27 | 48.0 a | 2.57 | 31.0 b | 0.85 | 2.8 ab | 0.27 | ||
| ON | B | 29 | 48.6 a | 1.41 | 33.9 a | 0.46 | 3.0 a | 0.19 | |
| D | 16 | 51.9 a | 3.04 | 34.4 a | 0.80 | 3.5 a | 0.41 | ||
| E | 34 | 47.4 a | 1.98 | 33.5 a | 0.79 | 3.0 a | 0.24 | ||
| F | 11 | 43.6 a | 2.39 | 32.7 a | 0.66 | 2.4 a | 0.26 | ||
| H | 23 | 43.0 a | 2.27 | 32.0 a | 0.81 | 2.4 a | 0.25 | ||
| Total | |||||||||
| OFF | All | 173 | 46.6 a | 0.83 | 32.9 a | 0.31 | 2.8 a | 0.01 | |
| ON | All | 113 | 47.0 a | 0.99 | 33.3 a | 0.34 | 2.9 a | 0.12 | |
| 1 Different lower case letters indicate a statistical difference at α = 5% in means from each attribute (dbh, height, and single-tree volume) between operating trails within a respective treatment based on Fisher’s LSD test. | |||||||||
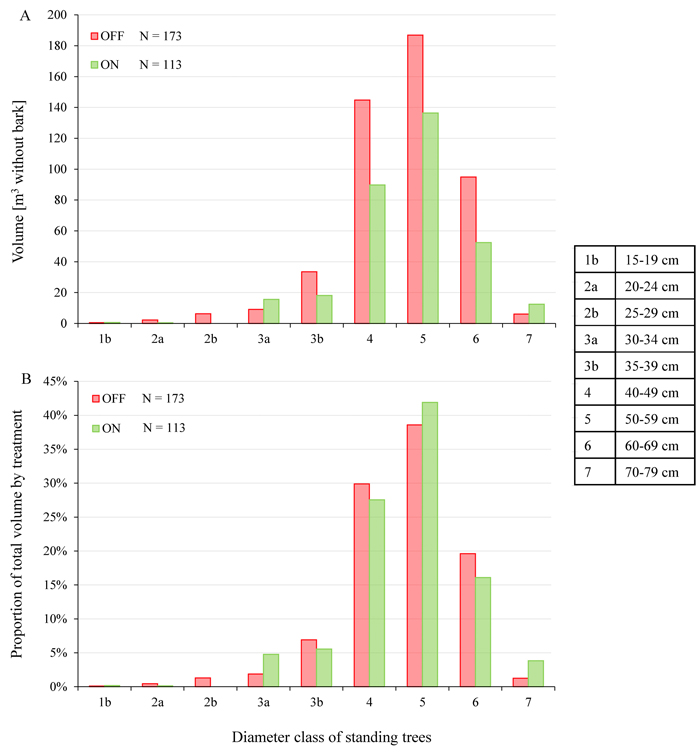
Fig. 4. A. Volume [m3 without bark] by diameter class and treatment, B. Proportion of total volume by treatment and diameter class; all harvested trees with pre-inventory data.
| Table 5. Sample size by harvesting system, tree shape, diameter class, and treatment; in brackets volume in m3 without bark. | ||||||||
| Diameter class | Harvesting system | |||||||
| Fully-mechanized | Semi-mechanized | |||||||
| Undamaged | Damaged | Undamaged | Damaged | |||||
| OFF | ON | OFF | ON | OFF | ON | OFF | ON | |
| 1b | 1 (0.2) | 1 (0.2) | - | - | 1 (0.2) | 1 (0.1) | - | - |
| 2a | 2 (0.8) | - | - | 1 (0.4) | 2 (0.7) | - | - | - |
| 2b | 6 (3.5) | - | - | - | 1 (0.5) | - | 1 (0.8) | - |
| 3a | 3 (2.7) | 5 (4.5) | - | 2 (1.8) | 4 (3.3) | 5 (4.7) | 1 (0.7) | 1 (0.8) |
| 3b | 12 (16.8) | 3 (3.7) | 2 (2.7) | - | 5 (6.6) | 7 (7.4) | 1 (1.1) | 1 (1.3) |
| 4 | 26 (43.5) | 12 (20.6) | 11 (16.6) | 6 (10.2) | 14 (24.2) | 11 (18.6) | 8 (13.9) | 8 (13.3) |
| 5 | 23 (56.2) | 13 (28.9) | 7 (16.2) | 3 (8.0) | 10 (24.4) | 15 (35.4) | 12 (29.4) | 5 (13.7) |
| 6 | 8 (26.8) | 4 (12.2) | 4 (12.4) | 1 (3.2) | 6 (21.5) | 5 (14.9) | 1 (2.9) | 1 (3.0) |
| 7 | - | 1 (3.5) | - | - | 1 (4.0) | 1 (3.7) | - | - |
| Total | 81 (150.4) | 39 (73.5) | 24 (47.9) | 13 (23.6) | 44 (85.3) | 45 (84.7) | 24 (48.8) | 16 (32.1) |
| Average single-tree volume | 1.9 a1 | 1.9 a | 2.0 a | 1.8 a | 1.9 a | 1.9 a | 2.0 a | 2.0 a |
| Relative product recovery | 72% a | 68% a | 65% b | 70% a | 68% ab | 66% a | 70% ab | 69% a |
| 1 Different lower case letters indicate a statistical difference at α = 5% in means between treatments (OFF and ON) within a respective attribute based on Fisher’s LSD test. | ||||||||
| Table 6. Relative product recovery by harvesting system, tree shape, and treatment. | ||
| Harvesting system | Treatment | |
| OFF | ON | |
| Fully-mechanized | 71% a1 | 69% a |
| Semi-mechanized | 69% a | 67% a |
| Undamaged | 71% a | 67% b |
| Damaged | 68% a | 69% a |
| Total | 70% a | 68% a |
| 1 Different lower case letters indicate a statistical difference at α = 5% in means between treatments (OFF and ON) within a respective attribute based on Fisher’s LSD test. | ||
| Table 7. Volume in m3 without bark by harvesting system, tree shape, assortment, and treatment; in brackets is the relative frequency expressed in percentage. | ||||||||
| Assortment | Harvesting system | |||||||
| Fully-mechanized | Semi-mechanized | |||||||
| Undamaged | Damaged | Undamaged | Damaged | |||||
| OFF | ON | OFF | ON | OFF | ON | OFF | ON | |
| Large diameter sawlog | 5.5 (4) | 2.0 (3) | 0.9 (2) | 0.7 (3) | 7.2 (8) | 1.1 (1) | 1.8 (4) | 0.9 (3) |
| Sawlog-5.0 m | 115.3 (77) | 27.7 (38) | 37.2 (78) | 8.9 (38) | 63.4 (74) | 32.9 (39) | 37.5 (77) | 12.0 (37) |
| Sawlog-4.0 m | 1.6 (1) | 39.4 (54) | 1.0 (2) | 12.5 (53) | 3.5 (4) | 45.7 (54) | 2.6 (5) | 16.3 (51) |
| Pallet | 20.1 (13) | 1.6 (2) | 6.6 (14) | 0.6 (3) | 7.7 (9) | 2.7 (3) | 4.1 (8) | 2.2 (7) |
| Low-grade pulpwood 2–3 m | 6.2 (4) | 1.4 (2) | 2.0 (4) | 0.3 (1) | 2.2 (3) | 1.1 (1) | 1.7 (3) | 0.5 (1) |
| Pulpwood 2–3 m | 1.7 (1) | 1.4 (2) | 0.2 (0) | 0.6 (2) | 1.4 (2) | 1.0 (1) | 1.2 (2) | 0.3 (1) |
| Total | 150.4 (100) | 73.5 (100) | 47.9 (100) | 23.6 (100) | 85.3 (100) | 84.7 (100) | 48.8 (100) | 32.1 (100) |
| Table 8. Harvesting productivity [m3 PMH0–1] by harvesting system and treatment; harvested trees with pre-inventory data. | |||||
| Harvesting system | Treatment | N | Average single-tree volume [m3 without bark] | Harvesting productivity [m3 PMH0–1] | SE |
| Fully-mechanized-undamaged | OFF | 106 | 1.8 a1 | 43.3 a | 1.4 |
| ON | 54 | 1.8 a | 50.3 b | 2.1 | |
| Fully-mechanized-damaged | OFF | 29 | 1.9 a | 45.9 a | 1.8 |
| ON | 14 | 1.8 a | 48.6 a | 3.9 | |
| Semi-mechanized-undamaged | OFF | 92 | 1.8 a | 53.9 a | 2.1 |
| ON | 76 | 1.7 a | 60.6 a | 3.0 | |
| Semi-mechanized-damaged | OFF | 39 | 2.1 a | 58.3 a | 2.7 |
| ON | 25 | 1.9 a | 54.9 a | 2.9 | |
| Fully-mechanized | OFF | 135 | 1.8 a | 43.9 a | 1.2 |
| ON | 68 | 1.8 a | 50.0 b | 1.9 | |
| Semi-mechanized | OFF | 131 | 1.9 a | 55.2 a | 1.7 |
| ON | 101 | 1.7 a | 59.1 a | 2.4 | |
| Undamaged | OFF | 198 | 1.8 a | 48.0 a | 1.2 |
| ON | 130 | 1.7 a | 56.0 b | 1.9 | |
| Damaged | OFF | 68 | 2.0 a | 52.9 a | 1.9 |
| ON | 39 | 1.8 a | 52.6 a | 2.3 | |
| Total | OFF | 266 | 1.9 a | 49.2 a | 1.0 |
| ON | 169 | 1.7 a | 55.3 b | 1.6 | |
| 1 Different lower case letters indicate a statistical difference at α = 5% in means between treatments (OFF and ON) within a respective attribute based on Fisher’s LSD test. | |||||
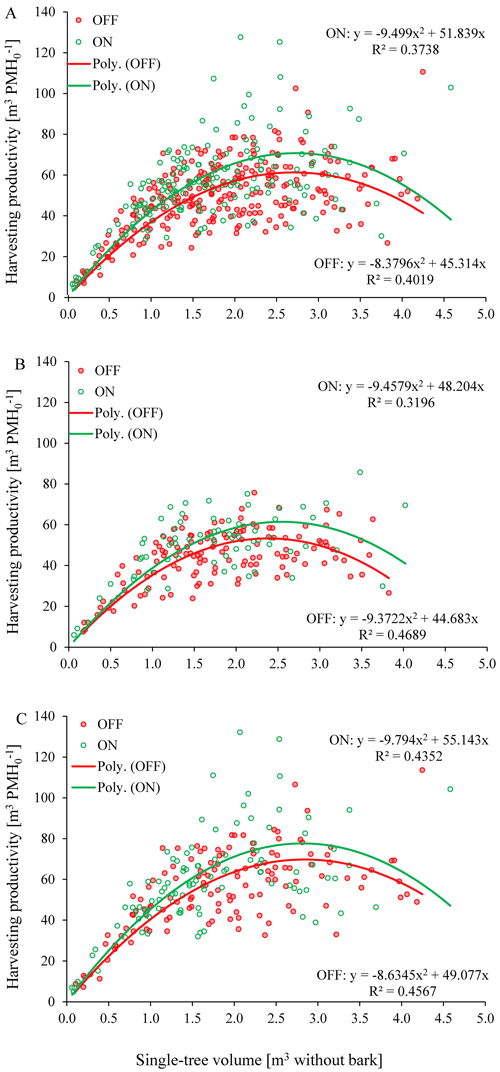
Fig. 5. Harvesting productivity [m3 PMH0–1] in function of single-tree volume: A. “total”, B. “fully-mechanized”, C. “semi-mechanized”; harvested trees with time and motion data.
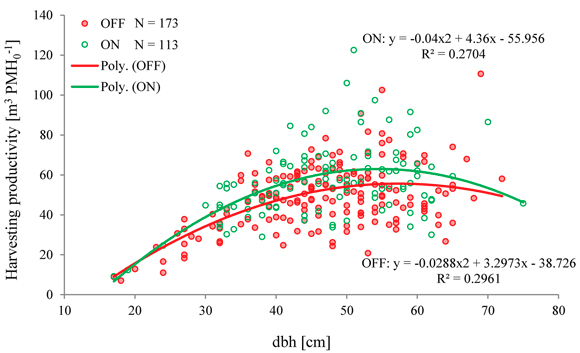
Fig. 6. Harvesting productivity [m3 PMH0–1] in function of tree dbh for all harvested trees with pre-harvest inventory data.
| Table 9. Mean revenue [€/m3] per harvesting system, shape, treatment, and diameter class; harvested trees with pre-inventory data. | |||||||||
| Harvesting system | |||||||||
| Fully-mechanized | Semi-mechanized | ||||||||
| Undamaged | Damaged | Undamaged | Damaged | ||||||
| OFF | ON | OFF | ON | OFF | ON | OFF | ON | ||
| Diameter class | 1b | 63.7 € | 67.4 € | - | - | 79.6 € | 69.6 € | - | |
| 2a | 73.9 € | - | - | 81.6 € | 79.4 € | - | - | ||
| 2b | 78.5 € | - | - | - | 79.5 € | - | 91.3 € | - | |
| 3a | 91.3 € | 97.0 € | - | 99.4 € | 96.8 € | 94.3 € | 97.4 € | 95.9 € | |
| 3b | 96.1 € | 99.1 € | 102.8 € | - | 94.7 € | 99.1 € | 95.6 € | 98.1 € | |
| 4 | 96.4 € | 101.0 € | 95.9 € | 101.8 € | 99.5 € | 102.0 € | 96.4 € | 101.0 € | |
| 5 | 98.6 € | 102.8 € | 102.2 € | 100.2 € | 101.1 € | 102.6 € | 100.7 € | 100.6 € | |
| 6 | 102.9 € | 101.4 € | 93.5 € | 96.2 € | 100.6 € | 101.6 € | 106.5 € | 93.4 € | |
| 7 | - | 95.2 € | - | - | 91.4 € | 96.3 € | - | ||
| Ø | 95.1 € a1 | 100.0 € a | 97.9 € a | 99.1 € a | 97.2 € a | 100.0 € a | 98.8 € a | 99.9 € a | |
| 1 Different lower case letters indicate a statistical difference at α = 5% in means between treatments (OFF and ON) based on Fisher’s LSD test. | |||||||||
| Table 10. Mean revenue [€/m3] per harvesting system, tree shape, and treatment; harvested trees with pre-inventory data. | ||||
| Harvesting system | Treatment | Difference | Proportional difference to revenue treatment OFF (%) | |
| OFF | ON | |||
| Fully-mechanized | 95.8 €/m3 a1 | 99.7 €/m3 b | +4.0 €/m3 | 4 |
| Semi-mechanized | 97.8 €/m3 a | 100.0 €/m3 a | +2.2 €/m3 | 2 |
| Undamaged | 95.9 €/m3 a | 100.0 €/m3 b | +4.1 €/m3 | 4 |
| Damaged | 98.3 €/m3 a | 99.5 €/m3 a | +1.2 €/m3 | 1 |
| Total | 96.6 €/m3 a | 99.9 €/m3 b | +3.3 €/m3 | 3 |
| 1 Different lower case letters indicate a statistical difference at α = 5% in means between treatments (OFF and ON) within a respective attribute based on Fisher’s LSD test. | ||||