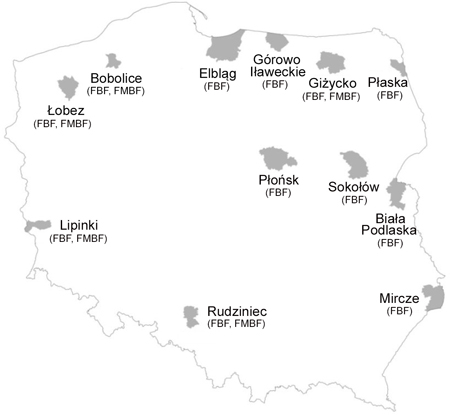
Fig. 1. Geographical layout of the forest districts where the test plots were located (Lachowicz 2015).
| Table 1. The basic density of birch wood [kg m–3] with respect to location and tree age. | |||||
| Location – Forest district | Tree age | Number of samples (N) | Average | Minimum | Maximum |
| 1 Płońsk FBF | 30 | 80 | 516 | 417 | 616 |
| 50 | 89 | 544 | 438 | 637 | |
| 70 | 96 | 550 | 482 | 615 | |
| Total | 265 | 538 | 417 | 637 | |
| 2 Sokołów FBF | 30 | 93 | 545 | 450 | 647 |
| 50 | 96 | 557 | 461 | 620 | |
| 70 | 96 | 544 | 445 | 616 | |
| Total | 285 | 549 | 445 | 647 | |
| 3 Biała Podlaska FBF | 30 | 87 | 511 | 433 | 577 |
| 50 | 96 | 548 | 470 | 652 | |
| 70 | 90 | 547 | 489 | 607 | |
| Total | 273 | 536 | 433 | 652 | |
| 4 Płaska FBF | 30 | 93 | 517 | 447 | 585 |
| 50 | 96 | 501 | 435 | 592 | |
| 70 | 96 | 518 | 450 | 577 | |
| Total | 285 | 512 | 435 | 592 | |
| 5 Giżycko FBF | 30 | 96 | 520 | 443 | 574 |
| 50 | 55 | 514 | 443 | 639 | |
| 70 | 96 | 548 | 476 | 617 | |
| Total | 247 | 530 | 443 | 639 | |
| 6 Giżycko FMBF | 30 | 96 | 527 | 442 | 636 |
| 50 | 96 | 555 | 456 | 630 | |
| 70 | 96 | 564 | 510 | 629 | |
| Total | 288 | 548 | 442 | 636 | |
| 7 Górowo Iławeckie FBF | 30 | 96 | 506 | 441 | 567 |
| 50 | 96 | 523 | 414 | 609 | |
| 70 | 94 | 545 | 460 | 624 | |
| Total | 286 | 525 | 414 | 624 | |
| 8 Elbląg FBF | 30 | 96 | 518 | 413 | 616 |
| 50 | 96 | 520 | 475 | 585 | |
| 70 | 96 | 527 | 439 | 625 | |
| Total | 288 | 522 | 413 | 625 | |
| 9 Mircze FBF | 30 | 96 | 527 | 457 | 585 |
| 50 | 96 | 542 | 444 | 617 | |
| 70 | 96 | 532 | 487 | 625 | |
| Total | 288 | 534 | 444 | 625 | |
| 10 Bobolice FBF | 30 | 95 | 507 | 407 | 569 |
| 50 | 96 | 518 | 456 | 590 | |
| 70 | 96 | 533 | 490 | 586 | |
| Total | 287 | 519 | 407 | 590 | |
| 11 Bobolice FMBF | 30 | 90 | 519 | 459 | 576 |
| 50 | 95 | 495 | 400 | 574 | |
| 70 | 95 | 532 | 432 | 593 | |
| Total | 280 | 515 | 400 | 593 | |
| 12 Łobez FBF | 30 | 87 | 477 | 404 | 562 |
| 50 | 96 | 547 | 462 | 608 | |
| 70 | 96 | 561 | 504 | 634 | |
| Total | 279 | 530 | 404 | 634 | |
| 13 Łobez FMBF | 30 | 91 | 487 | 425 | 552 |
| 50 | 96 | 511 | 469 | 565 | |
| 70 | 96 | 540 | 499 | 592 | |
| Total | 283 | 513 | 425 | 592 | |
| 14 Lipinki FBF | 30 | 89 | 501 | 427 | 565 |
| 50 | 96 | 526 | 469 | 608 | |
| 70 | 96 | 536 | 490 | 611 | |
| Total | 281 | 521 | 427 | 611 | |
| 15 Lipinki FMBF | 30 | 95 | 501 | 405 | 558 |
| 50 | 96 | 534 | 450 | 596 | |
| 70 | 96 | 551 | 489 | 603 | |
| Total | 287 | 528 | 405 | 603 | |
| 16 Rudziniec FBF | 30 | 96 | 500 | 447 | 601 |
| 50 | 96 | 526 | 435 | 602 | |
| 70 | 96 | 537 | 504 | 589 | |
| Total | 288 | 521 | 435 | 602 | |
| 17 Rudziniec FMBF | 30 | 95 | 537 | 450 | 618 |
| 50 | 96 | 526 | 423 | 606 | |
| 70 | 96 | 554 | 491 | 642 | |
| Total | 287 | 539 | 423 | 642 | |
| FBF | 3352 | 528 | 404 | 652 | |
| FMBF | 1425 | 529 | 400 | 642 | |
| Age 30 | 1571 | 513 | 404 | 647 | |
| Age 50 | 1583 | 529 | 400 | 652 | |
| Age 70 | 1623 | 542 | 432 | 642 | |
| Total | 4777 | 528 | 400 | 652 | |
| FBF – fresh broadleaved forest FMBF – fresh mixed broadleaved forest | |||||
| Table 2. Influence of location and tree age and the interaction of those properties on the basic density of wood (two-factor analysis of variance). | ||
| Source of variance | F empirical | p-value |
| Intercept | 1148482 | < 0.0001 * |
| Location | 31 | < 0.0001 * |
| Age | 301 | < 0.0001 * |
| Location-Age (interaction) | 16 | < 0.0001 * |
| * statistically significant at the 0.05 level | ||
| Table 3. Groups of homogeneous locations in terms of the mean values of basic density of wood. | |||||||
| Location | Mean | 1 | 2 | 3 | 4 | 5 | 6 |
| Płaska - FBF | 512 | **** | |||||
| Łobez - FMBF | 513 | **** | |||||
| Bobolice - FMBF | 515 | **** | **** | ||||
| Bobolice - FBF | 519 | **** | **** | **** | |||
| Rudziniec - FBF | 521 | **** | **** | **** | |||
| Lipinki - FBF | 521 | **** | **** | **** | |||
| Elbląg - FBF | 522 | **** | **** | **** | |||
| Górowo Iławeckie - FBF | 525 | **** | **** | **** | |||
| Lipinki - FMBF | 528 | **** | **** | **** | |||
| Giżycko - FBF | 530 | **** | **** | **** | |||
| Łobez - FBF | 530 | **** | **** | **** | |||
| Mircze - FBF | 534 | **** | **** | ||||
| Biała Podlaska - FBF | 536 | **** | |||||
| Płońsk - FBF | 538 | **** | **** | ||||
| Rudziniec - FMBF | 539 | **** | **** | ||||
| Giżycko - FMBF | 548 | **** | |||||
| Sokołów - FBF | 549 | **** | |||||
| FBF – fresh broadleaved forest FMBF – fresh mixed broadleaved forest | |||||||
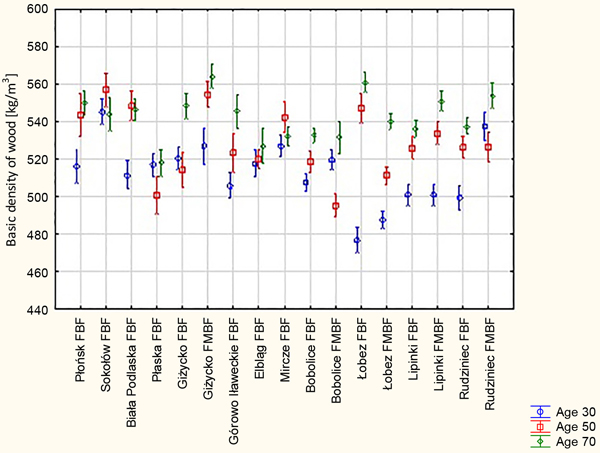
Fig. 2. Average values of basic density of wood and their standard errors, with respect to location and tree age.
| Table 4. Influence of tree age and thickness class and the interaction of those properties on the basic density of wood (two-factor analysis of variance). | ||
| Source of variance | F empirical | p-value |
| Intercept | 980706.861 | < 0.0001 * |
| Age | 252.457743 | < 0.0001 * |
| Thickness class | 12.4152923 | < 0.0001 * |
| Age-Thickness class (interaction) | 16.426154 | < 0.0001 * |
| * statistically significant at the 0.05 level | ||
| Table 5. Properties of the basic density of wood for different tree age and thickness classes. | |||
| Age | Thickness class | Mean | Number of samples (N) |
| 30 | 1 | 512 | 484 |
| 2 | 513 | 544 | |
| 3 | 514 | 543 | |
| 50 | 1 | 531 | 526 |
| 2 | 521 | 523 | |
| 3 | 534 | 534 | |
| 70 | 1 | 551 | 537 |
| 2 | 541 | 544 | |
| 3 | 535 | 542 | |
| Total | 528 | 4777 | |
| Table 6. Influence of location and the forest habitat type and the interaction of those properties on the basic density of wood (two-factor analysis of variance). | ||
| Source of variance | F empirical | p-value |
| Intercept | 604983.0 | < 0.0001 * |
| Location | 30.0 | < 0.0001 * |
| FHT | 11.8 | 0.0006 * |
| Location-FHT (interaction) | 24.6 | < 0.0001 * |
| * statistically significant at the 0.05 level FHT – forest habitat type | ||
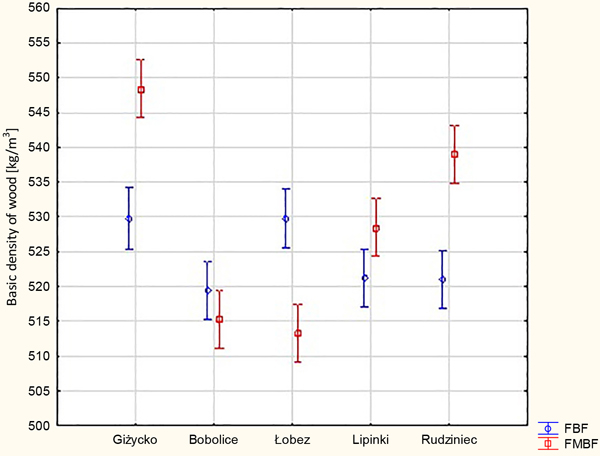
Fig. 3. Average values of basic density of wood from selected locations in different forest habitat types.