| Table 1. Basic characteristic of analysed stands. | ||||||
| Stand | Latitude, longitude | Age (year) | Upper stand height (m) | Average (Min – max.) number of trees (pcs ha-1) | Mean basal area (m2 ha-1) | Average DBH (±SD) (cm) |
| Altitude (m) | ||||||
| Tipecek | 49°19´N, 16°44´E | 4 | 4 | 42 890 (2000 – 95 000) | 2.8670 | 0.72 (0.57) |
| 510 | 5 | 43 670 (4000 – 99 000) | 4.7680 | 0.97 (0.66) | ||
| Breziny | 49°69´N, 18°19´E | 8 | 7 | 18 720 (6400 – 48 000) | 7.2328 | 1.89 (1.18) |
| 285 | 9 | 18 720 (6400 – 48 000) | 9.8538 | 2.24 (1.40) | ||
| Dubska | 49°88´N, 18°10´E | 17 | 15 | 4720 (2800 – 6400) | 22.0204 | 7.00 (3.23) |
| 324 | 18 | 4720 (2800 – 6400) | 23.3443 | 7.18 (3.40) | ||
| Skrchov | 49°59´N, 16°55´E | 22 | 17 | 2800 (2000 – 3600) | 25.7693 | 10.20 (3.66) |
| 475 | 23 | 2800 (2000 – 3600) | 26.4830 | 10.33 (3.74) | ||
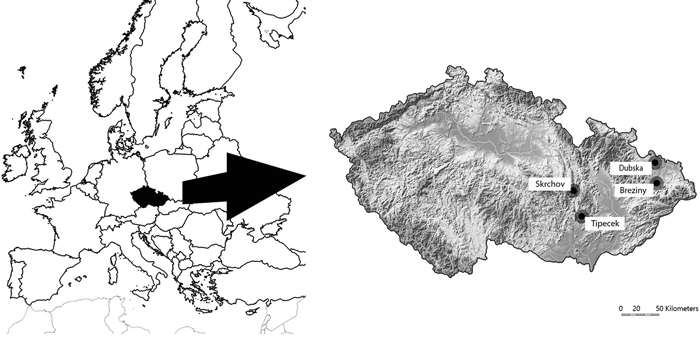
Fig. 1. Location of the experimental stands in the Czech Republic.
| Table 2. Estimated parameters (a, b) of biomass equations (Eq. 1) for individual tree components of above-ground dry biomass (AB) of birch. Abbreviations: N – number of sampled tree; R2 – coefficient of determination, SE – standard error of parameter. | |||||||||||
| ABtotal | ABstem | ABbranch | |||||||||
| Stand | Age | N | a (SE) | b (SE) | R2 | a (SE) | b (SE) | R2 | a (SE) | b (SE) | R2 |
| Tipecek | 5 | 37 | 0.14107 (0.00946) | 2.18716 (0.07429) | 0.980 | 0.11431 (0.00672) | 2.01210 (0.06639) | 0.981 | 0.02511 (0.00518) | 2.78590 (0.21770) | 0.917 |
| Breziny | 9 | 36 | 0.10941 (0.00832) | 2.40663 (0.04607) | 0.993 | 0.10189 (0.00813) | 2.24554 (0.04897) | 0.990 | 0.01422 (0.00139) | 2.87939 (0.05751) | 0.993 |
| Dubska | 18 | 8 | 0.22062 (0.06674) | 2.15318 (0.12325) | 0.993 | 0.22533 (0.08166) | 2.08008 (0.14806) | 0.989 | 0.00872 (0.00439) | 2.68412 (0.20206) | 0.989 |
| Skrchov | 23 | 7 | 0.11792 (0.06954) | 2.40272 (0.23525) | 0.971 | 0.12251 (0.07621) | 2.35227 (0.24854) | 0.966 | 0.00192 (0.00104) | 3.05616 (0.21198) | 0.987 |
| Table 3. Mean dry above-ground biomass for individual tree components (AB) (t ha–1) for analysed birch stands (MAI – mean annual increment, CAI – current annual increment). | ||||||||
| Stand | Tipecek | Breziny | Dubska | Skrchov | ||||
| Age | 4 | 5 | 8 | 9 | 17 | 18 | 22 | 23 |
| ABbranch | 1.39 | 2.38 | 3.51 | 5.54 | 11.38 | 12.18 | 9.07 | 9.44 |
| ABstem | 4.41 | 6.98 | 12.23 | 17.37 | 75.43 | 77.92 | 97.05 | 99.36 |
| ABtotal | 5.80 | 9.36 | 15.73 | 22.91 | 86.81 | 90.10 | 106.12 | 108.80 |
| MAIABtotal | 1.45 | 1.87 | 1.97 | 2.55 | 5.11 | 5.01 | 4.82 | 4.73 |
| CAIABtotal | 3.55 | 7.18 | 3.29 | 2.67 | ||||
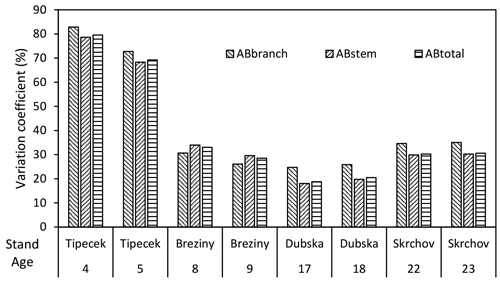
Fig. 2. Variability of total above-ground biomass (AB) and its components (stem and branches) within analysed birch stands.
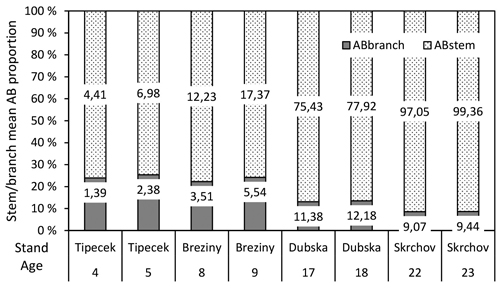
Fig. 3. Stem/branch mean AB proportion (%) within analysed stands and ages (numbers inside bars – AB in t ha-1).
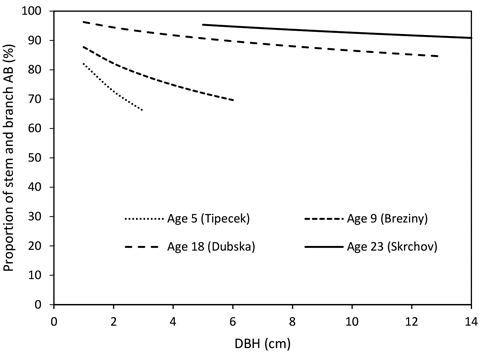
Fig. 4. Proportion of stem and branch above-ground biomass (AB) of sample trees of analysed stands according to DBH (stem AB – below curves, branch AB – above curves).
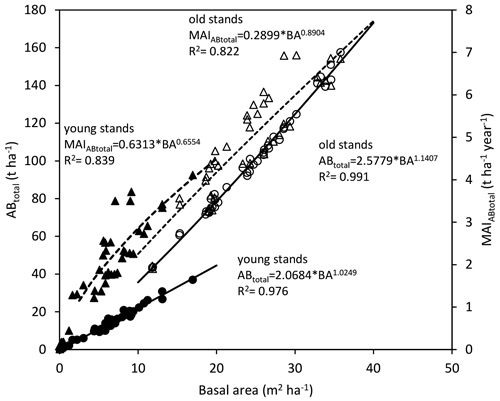
Fig. 5. Total above-ground biomass (ABtotal) and total dry above-ground biomass mean annual increment (MAIABtotal) in relation to basal area on plots in young and old stands (points represent values on each inventory plot: full circles – ABtotal of young stands, empty circles – ABtotal of old stands, full triangles – MAIABtotal of young stands, empty triangles – MAIABtotal of old stands).
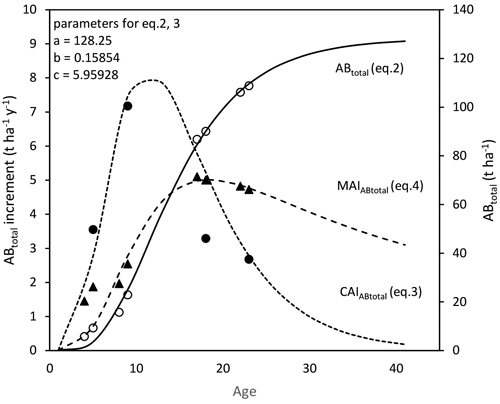
Fig. 6. Observed data and models of total above-ground biomass (ABtotal), current annual increment (CAIABtotal), and dry above-ground biomass mean annual increment (MAIABtotal) (points represent values found in observed years).