| Table 1. Data sets used for developing discriminant model to distinguish seeds of two birch species (Betula spp.), together with number of families included in each species, total number of seeds per species, validation sets and number of outliers excluded during model development. | ||
| Data sets | Betula pubescens | Betula pendula |
| No. of families | 15 | 13 |
| Total No. seeds | 750 | 650 |
| Calibration set | 497 | 399 |
| External test set* | 250 | 250 |
| Outliers | 3 | 1 |
| * External test set is composed of samples from five families that were not part of the calibration model. | ||
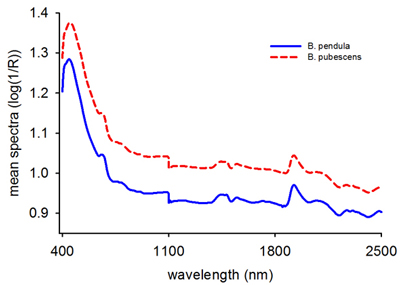
Fig. 1. Mean raw reflectance spectra (log 1/R) of Betula pendula and B. pubescens seeds.
| Table 2. A statistical summary of discriminant models computed to identify Betula pubescens and B. pendula seeds using full (400–2500 nm), visible (400–780 nm) and near infrared (780–2500 nm) reflectance spectral region. | |||
| Model Statistics | Wavelength region (nm) | ||
| 400–2500 | 400–780 | 780–2500 | |
| Number of significant components (A)* | 1 + 11 | 1 + 7 | 1 + 16 |
| Predictive spectral variation (R2Xp) | 0.125 | 0.138 | 0.114 |
| Y-orthogonal spectral variation (R2Xo) | 0.875 | 0.861 | 0.886 |
| Modelled class variation (R2Y) | 0.884 | 0.833 | 0.924 |
| Predictive power of a model (Q2) | 0.877 | 0.828 | 0.917 |
| * The first and second values represent the number of components for predictive and orthogonal variations, respectively. | |||
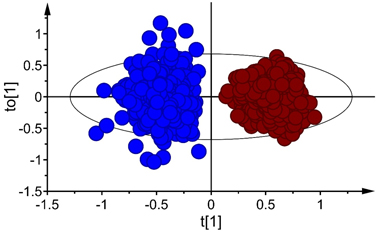
Fig. 2. Score plot for the first predictive (tp[1]) and orthogonal (to[1]) components of OPLS-DA model developed in Vis+ NIR range, depecting clear-cut separation of seeds of Betula pubescens (●) and B. pendula (●). Note that the ellipse shows 95% confidence interval according to Hotelling’s test.
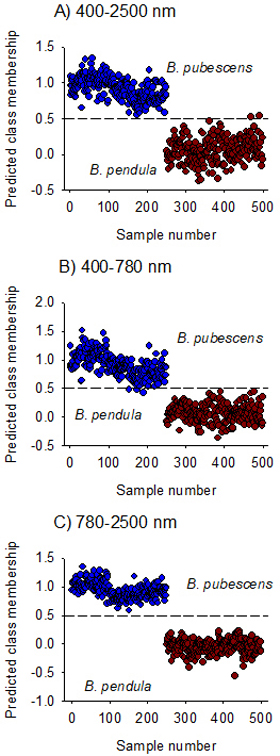
Fig. 3. Predicted Class membership of samples in the test set for seeds of Betula pendula and B. pubescens by OPLS-DA models fitted on Vis + NIR (panel A), visible (panel B) and NIR (panel C) regions. Note that the dashed line is threshold for classification (Ypred > 0.5).
| Table 3. Performance of classification model developed for identifying seeds of two birch species (Betula spp.) by multivariate discriminant analysis of NIR reflectance spectra. Sn is class sensitivity, Sp is class specificity, CA and ER are classification accuracy and error rate, respectively. | |||||
| Species | test set | Sn | Sp | CA | ER |
| Betula pubescens | Seedlot-1 | 1.0 | 1.0 | 1.0 | 0.0 |
| Seedlot-2 | 1.0 | 1.0 | 1.0 | 0.0 | |
| Seedlot-3 | 1.0 | 1.0 | 1.0 | 0.0 | |
| Seedlot-4 | 1.0 | 1.0 | 1.0 | 0.0 | |
| Seedlot-5 | 1.0 | 1.0 | 1.0 | 0.0 | |
| Mean CA | 1.0 | ||||
| Mean ER | 0.0 | ||||
| Betula pendula | Seedlot-1 | 1.0 | 1.0 | 1.0 | 0.0 |
| Seedlot-2 | 1.0 | 1.0 | 1.0 | 0.0 | |
| Seedlot-3 | 1.0 | 1.0 | 1.0 | 0.0 | |
| Seedlot-4 | 1.0 | 1.0 | 1.0 | 0.0 | |
| Seedlot-5 | 1.0 | 1.0 | 1.0 | 0.0 | |
| Mean CA | 1.0 | ||||
| Mean ER | 0.0 | ||||
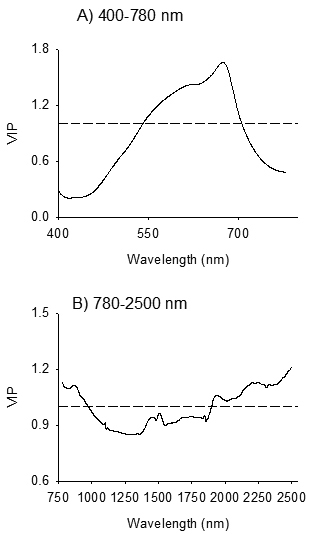
Fig. 4. Variable influence on Projection (VIP) plots depicting absorption bands accounted for identification of seeds of Betula pendula and B. pubescens by discriminant modelling of VIS (Panel A) and NIR (Panel B) spectral regions. The dashed line shows the threshold of significant contribution in model (VIP = 1).