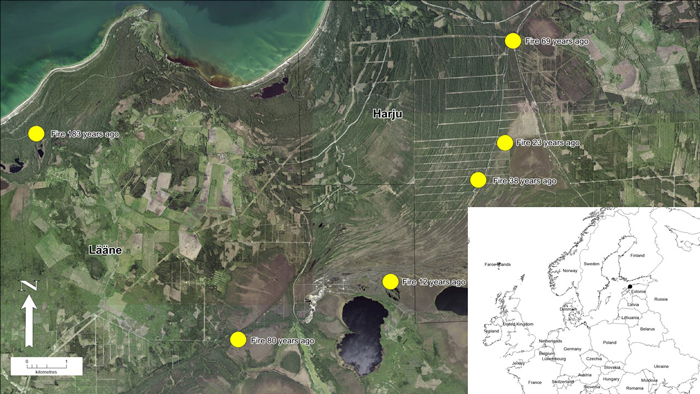
Fig 1. Location of study area in northwestern Estonia. Yellow dots represent pine stands (n = 6) with different age (time since fire) in the post-fire chronosequence. View larger in new window/tab.
| Table 1. Main characteristics of studied stands (n = 6) in the post-fire chronosequence in northwestern Estonia. | ||||||||||
| Years since fire | Coordinates* | Area burned* | Forest site type* | Tree species composition (%) Pi – Scots pine; Bi – Silver birch* | Tree diameter (mean, cm)* | Tree height (mean, m)* | Living trees ha–1 | Soil type (World Reference Base classification)* | Canopy openness (mean ± SE, %) | Basal area (m2 ha–1) |
| 12 | 59°11´N, 23°46´E | about 800 ha | Vaccinium uliginosum | 56 Pi, 44 Bi | 1.9 | 1.1 | 1442 | gleyic podzol | 80.6 ± 2.4 | 0.4 |
| 23 | 59°12´N, 23°49´E | about 700 ha | Calluna | 91 Pi, 9 Bi | 3.9 | 2.9 | 2684 | gleyic podzol | 35.3 ± 2.8 | 3.2 |
| 38 | 59°11´N, 23°46´E | about 200 ha | Calluna | 100 Pi | 7.2 | 5.5 | 3167 | gleyic podzol | 19.2 ± 1.1 | 12 |
| 69 | 59°14´N, 23°49´E | about 2000 ha | Calluna/Cladina | 93 Pi, 7 Bi | 12.5 | 11.1 | 1583 | gleyic podzol | 27.6 ± 0.8 | 19.4 |
| 80 | 59°10´N, 23°42´E | about 200 ha | Vaccinium uliginosum | 100 Pi | 10.4 | 9.4 | 3117 | gleyic podzol | 22.1 ± 1.2 | 24.2 |
| 183 | 59°13´N, 23°36´E | about 200 ha (exactly unknown) | Calluna | 100 Pi | 21.8 | 13.4 | 558 | gleyic podzol | 31.5 ± 0.3 | 21 |
| * data originates from Köster et al. 2016 | ||||||||||
| Table 2. Floristic variables in vegetation plots (n = 18) and the effects of environmental factors (standardized coefficients) on them, based on final linear mixed models after backward variable selection. PC1 and PC2 – principal components representing soil variables (detailed description of PCs is provided in the Data analysis section). | |||||||
| Response variable | Mean | Min | Max | Factor effect, standardized coefficient | |||
| Time since fire | Transmitted total radiation | PC1 | PC2 | ||||
| Cover of understorey vascular plant layer | 43.6 | 7 | 70 | 0.94 ± 0.24 | 0.75 ± 0.24 | - | - |
| Cover of bryophyte layer | 52.9 | 15 | 90 | 0.78 ± 0.16 | - | - | - |
| Richness of vascular plants | 7.8 | 5 | 13 | - | - | - | - |
| Shannon’s diversity index of vascular plants | 1.2 | 0.6 | 2.0 | - | - | - | - |
| Richness of shrubs and young trees | 1.8 | 0 | 4 | - | - | - | –0.61 ± 0.20 |
| Richness of dwarf-shrubs | 3.6 | 1 | 6 | 0.60 ± 0.20 | - | - | - |
| Richness of graminoids | 1.4 | 0 | 4 | - | –0.45 ± 0.17 | - | –0.65 ± 0.17 |
| Richness of forbs | 1.0 | 0 | 2 | - | - | - | - |
| Richness of bryophytes | 10.9 | 5 | 21 | - | 0.44 ± 0.16 | –0.61 ± 0.16 | –0.49 ± 0.15 |
| Shannon’s diversity index of bryophytes | 1.3 | 0.7 | 1.7 | - | - | - | –0.49 ± 0.22 |
| Richness of liverworts | 1.7 | 0 | 5 | –0.74 ± 0.16 | - | –0.61 ± 0.16 | - |
| Richness of mosses | 9.2 | 4 | 18 | - | - | –0.45 ± 0.18 | –0.57 ± 0.18 |
| Richness of ground-dwelling bryophytes | 8.3 | 3 | 18 | - | 0.42 ± 0.19 | - | –0.52 ± 0.19 |
| Richness of bryophytes on pine trees | 2.1 | 0 | 5 | - | –0.69 ± 0.18 | - | - |
| Richness of bryophytes on birch trees | 1.3 | 0 | 11 | - | - | - | - |
| Richness of bryophytes on dead-wood | 3.6 | 0 | 12 | - | - | –0.55 ± 0.15 | –0.59 ± 0.15 |
| Table 3. Relationships between vascular plant and bryophyte species composition (non-metric multidimensional scaling, Fig. 2) and environmental variables in a post-fire chronosequence in northwestern Estonia. R2 – correlation between environmental variable and ordination. P-values are based on random permutations of the data, significant relationships (p < 0.05) are shown in bold. | ||||
| Environmental variable | Vascular plants | Bryophytes | ||
| r2 | p-value | r2 | p-value | |
| Time since fire | 0.62 | 0.001 | 0.60 | 0.001 |
| Canopy transmitted direct radiance | 0.56 | 0.006 | 0.65 | 0.001 |
| Canopy transmitted diffuse radiance | 0.57 | 0.003 | 0.65 | 0.002 |
| Canopy transmitted total radiance | 0.57 | 0.004 | 0.65 | 0.001 |
| Canopy openness | 0.58 | 0.003 | 0.63 | 0.002 |
| soil pH | 0.36 | 0.033 | 0.30 | 0.064 |
| soil N | 0.13 | 0.383 | 0.38 | 0.023 |
| soil P | 0.25 | 0.121 | 0.47 | 0.007 |
| soil K | 0.33 | 0.045 | 0.53 | 0.004 |
| soil C | 0.25 | 0.112 | 0.49 | 0.006 |
| soil Ca | 0.34 | 0.046 | 0.19 | 0.219 |
| soil Mg | 0.28 | 0.081 | 0.36 | 0.033 |
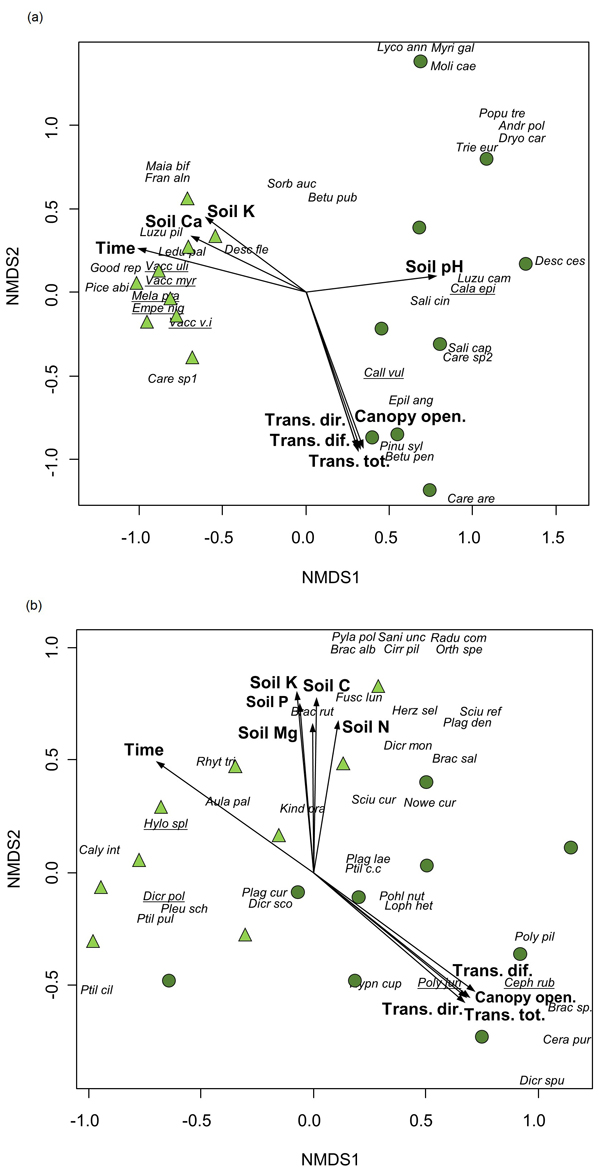
Fig. 2. Non-metric multidimensional scaling of a) vascular plants (2-dimensional solution, stress 0.12) and b) bryophytes (stress 0.14) from vegetation plots (n = 18) in a post-fire chronosequence in northwestern Estonia. Environmental factors that were significantly (p < 0.05) related to ordination axes (Table 3) are presented (Time – time since fire, Trans.dir. – canopy transmitted direct radiance, Trans.dif. – canopy transmitted diffuse radiance, Trans.tot. – canopy transmitted total radiance; Canopy open. – percentage of canopy openness, Soil pH – soil pH, Soil N – content of soil N, Soil P – content of soil P, Soil K – content of soil K, Soil C – content of soil C, Soil Ca – content of soil Ca, Soil Mg – content of soil Mg). Circles – vegetation plots in stands with 12 to 38 years since fire, triangles – vegetation plots in stands with 69 to 183 years since fire. Characteristic species of Indicator Species Analysis are underlined. Species abbreviations are provided in Supplementary file S1.