| Table 1. Geographic origin, mtDNA and cpDNA haplotypes and number of plants subjected to morphological analysis in the investigated locations of Picea spp. View larger in new window/tab. |
| Table 2. GenBank accession numbers for chloroplast and mitochondrial haplotypes discovered. | ||
| Haplotype | Haplotype full name | GenBank accession number |
| _CCC | _CCC_abies_i2 | KF896137 |
| _CAC | _CAC_abies_m3 | KF896138 |
| _CCA | _CCA_obovata_d11 | KF896139 |
| _TCC | _TCC_abies_c9 | KF896140 |
| GCAC | GCAC_abies_d4 | KF896141 |
| GCCA | GCCA_obovata_g3 | KF896142 |
| GCCC | GCCC_abies_b8 | KF896143 |
| 721bp | 721bp_obovata_c5 | KF896145 |
| 755bp | 755bp_na_l3 | KF896146 |
| 857bp | 857bp_obovata_m1 | KF896147 |
| 891bp | 891bp_abies_m5 | KF896148 |
| 925bp | 925bp_obovata_l1 | KF896149 |
| 959bp | 959bp_obovata_l2 | KF896150 |
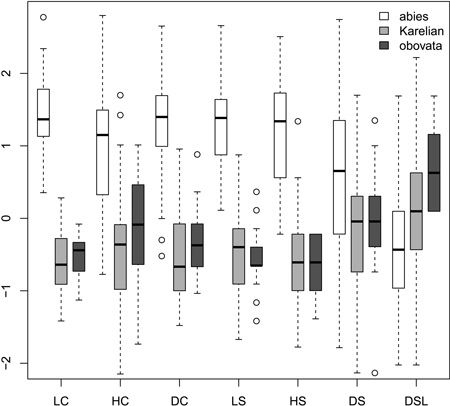
Fig. 1. Boxplots showing the variation of most frequently used scaled morphological characters. Characters are represented in values of standart deviations to facilitate comparison of variability in different characters. Absolute and quartile range along with median and outliers are given. Abbreviations are: LC, cone length; HC, cone maximal width; DC, distance from the base of cone to the position of maximal width; LS, scale length; HS, scale maximal width; DS, distance from the base of scale to the position of maximal width; DSL, scale width in 0.1 of HS distance from the tip.
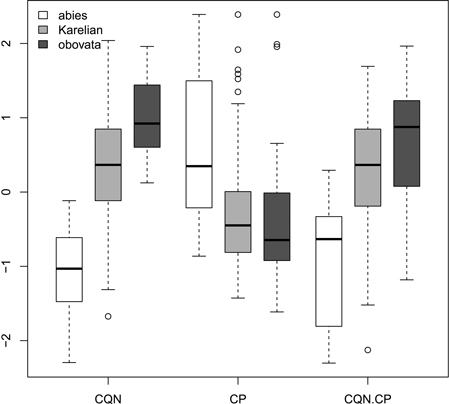
Fig. 2. Boxplots showing the variations of scaled morphological coefficients (ratios). Abbreviations are: CQN, equal to (scale width in 0.1 of scale maximal width distance from the tip) / (scale maximal width) * 100; CP, equal to [(scale length) − (distance from the base of scale to the position of maximal width)] / (scale maximal width) * 100; CQN.CP, equal to CQN – CP.
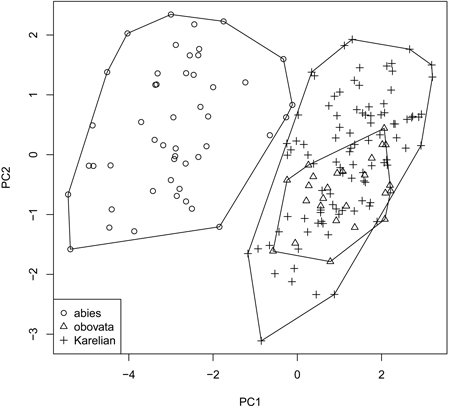
Fig. 3. Principal component ordination plot representing morphological diversity of studied spruces.
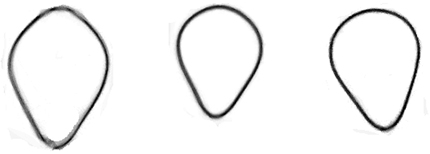
Fig. 4. Superimposed images of seed scales of studied spruces. From left to right: Picea abies, “Karelian spruces”, Picea obovata.
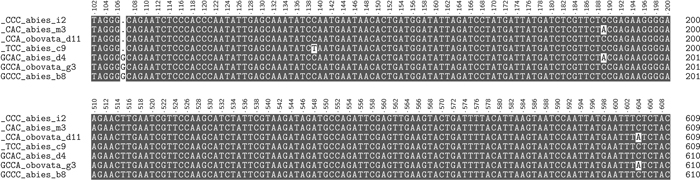
Fig. 5. Two fragments of the alignment of chloroplast haplotypes found, species identity and sample code are shown immediately after haplotype names. View larger in new window/tab.