| Table 1. The combinations of spacing and target graft height in the studied treatments within the experimental seed orchard. | ||||||||
| Target height of grafts (m) | ||||||||
| Stems ha–1 | Spacing (m) | 2 | 3 | 4 | 5 | 6 | Plot size (m) | No. grafts in each central plot |
| 4000 | 2.5 × 1.0 | A | 15 × 15 | 52 | ||||
| 2000 | 5.0 × 1.0 | C | 15 × 15 | 16 | ||||
| 1600 | 2.5 × 2.5 | B | 15 × 15 | 13 | ||||
| 1333 | 5.0 × 1.5 | D | 15 × 15 | 8 | ||||
| 889 | 7.5 × 1.5 | F | 15 × 30 | 16 | ||||
| 800 | 5.0 × 2.5 | E | 15 × 30 | 16 | ||||
| 667 | 7.5 × 2.0 | G | H | 15 × 30 | 10 | |||
| 533 | 7.5 × 2.5 | I | K | L | 15 × 30 | 8 | ||
| 267 | 7.5 × 5.0 | M | N | O | 30 × 30 | 8 | ||
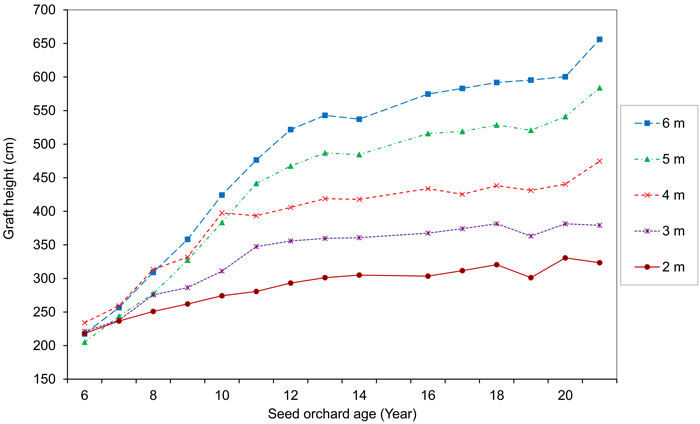
Fig. 1. Graft height before pruning in the autumn each year for treatments with different target heights.
| Table 2. Percentage of pollen-producing grafts (seed orchard age 9–11) and pollen production per year (seed orchard age 12–20) in the different treatments. View in new window/tab. |
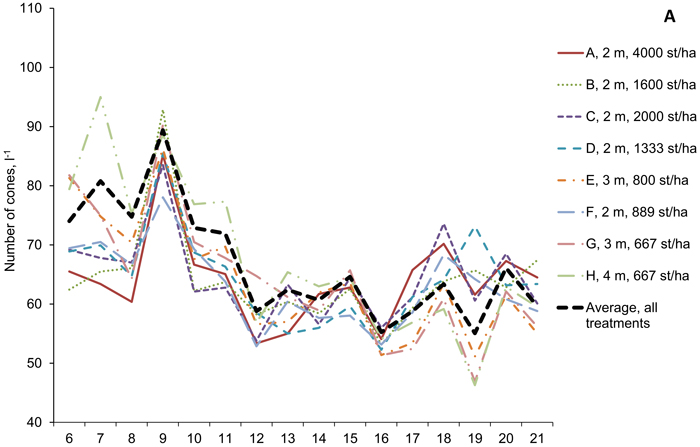
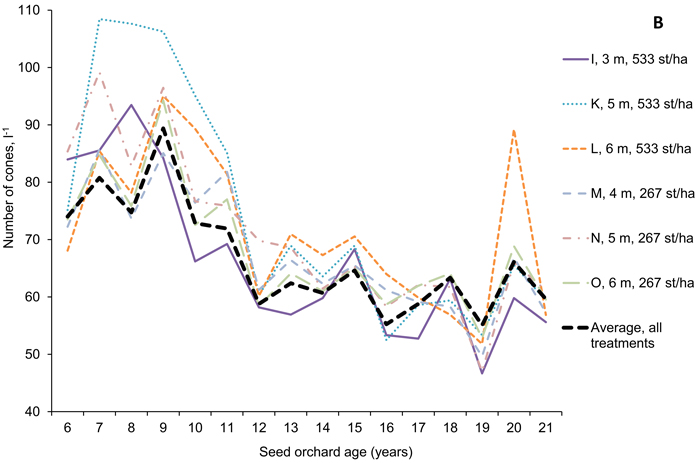
Fig. 2. Cone size, measured as number of cones per litre, from seed orchard age 6 to 21. In A: treatment A–H. In B: treatment I–O. Average for all treatments in both A and B.
| Table 3. Cone production (hl ha–1) for the combinations of spacing and target graft height in the experimental seed orchard. First figure is cone production from age 6 to 13 and second figure is cone production for the whole studied period (age 6 to 21). | ||||||
| Target height of grafts (m) | ||||||
| Stems ha–1 | Spacing (m) | 2 | 3 | 4 | 5 | 6 |
| 4000 | 2.5 × 1.0 | 105 / 177 | ||||
| 2000 | 5.0 × 1.0 | 73 / 183 | ||||
| 1600 | 2.5 × 2.5 | 90 / 193 | ||||
| 1333 | 5.0 × 1.5 | 60 / 144 | ||||
| 889 | 7.5 × 1.5 | 41 / 132 | ||||
| 800 | 5.0 × 2.5 | 55 / 223 | ||||
| 667 | 7.5 × 2.0 | 44 / 168 | 64 / 230 | |||
| 533 | 7.5 × 2.5 | 41 / 159 | 31 / 238 | 51 / 237 | ||
| 267 | 7.5 × 5.0 | 37 / 181 | 38 / 232 | 46 / 252 | ||
| Table 4. Seed mass (g (1000 seeds)–1) for the seed production from seed orchard age 6 to 21 for the different treatments. View in new window/tab. |
| Table 5. Seed production (kg ha–1) for the combinations of spacing and target graft height in the experimental seed orchard. First figure is seed production from age 6 to 13 and second figure is seed production for the whole studied period (age 6 to 21). | ||||||
| Target height of grafts (m) | ||||||
| Stems ha–1 | Spacing (m) | 2 | 3 | 4 | 5 | 6 |
| 4000 | 2.5 × 1.0 | 67 / 115 | ||||
| 2000 | 5.0 × 1.0 | 44 / 109 | ||||
| 1600 | 2.5 × 2.5 | 55 / 122 | ||||
| 1333 | 5.0 × 1.5 | 41 / 97 | ||||
| 889 | 7.5 × 1.5 | 28 / 88 | ||||
| 800 | 5.0 × 2.5 | 39 / 148 | ||||
| 667 | 7.5 × 2.0 | 30 / 111 | 44 / 153 | |||
| 533 | 7.5 × 2.5 | 27 / 98 | 22 / 158 | 37 / 158 | ||
| 267 | 7.5 × 5.0 | 27 / 116 | 22 / 128 | 29 / 172 | ||
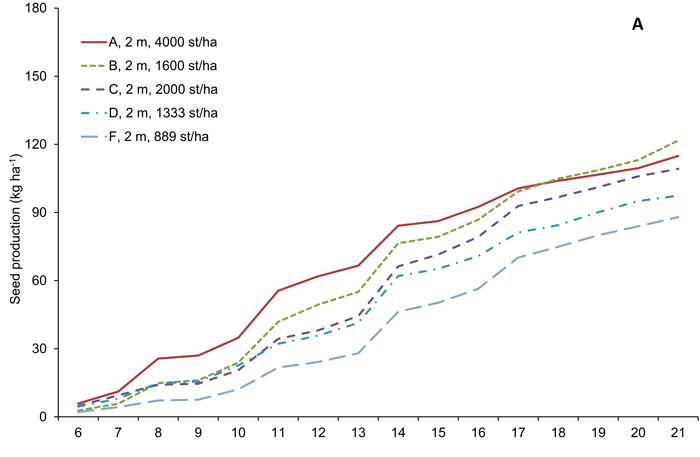
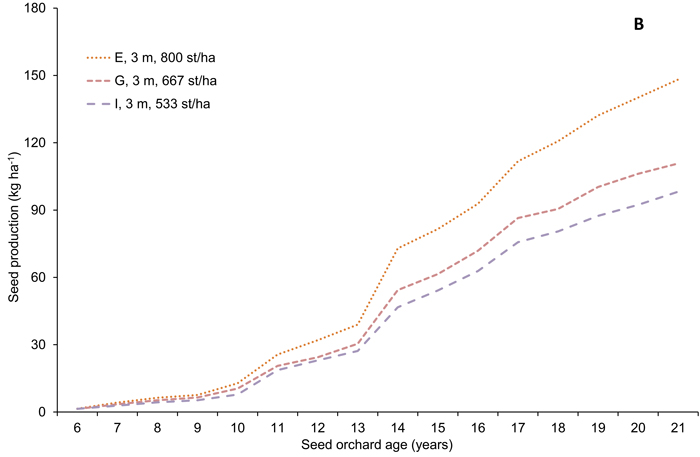
Fig. 3a. Cumulative seed production per hectare from seed orchard age 6 to 21 (kg ha–1) in treatments with A: target height of 2 metres, and B: target height of 3 metres.
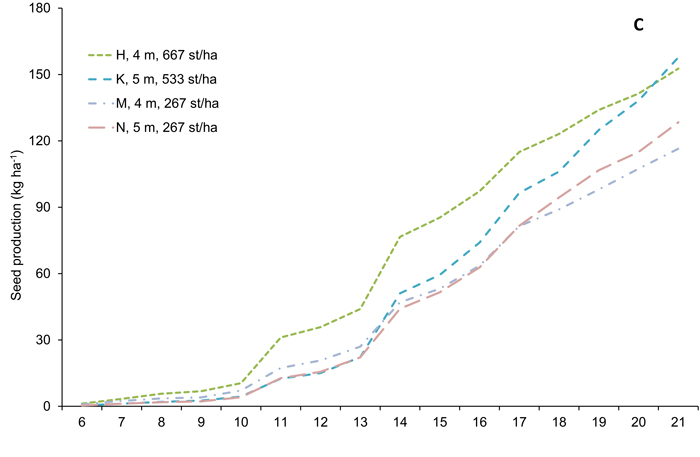
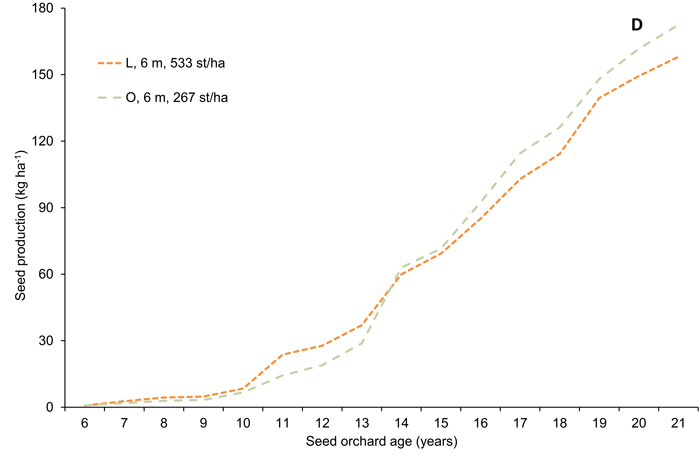
Fig. 3b. Cumulative seed production per hectare from seed orchard age 6 to 21 (kg ha–1) in treatments with C: target heights of 4 and 5 metres, and D: target height of 6 metres.