| Table 1. Summary of the range values (min-max) of biometric variables and total aboveground biomass of shrubs and small trees (DBH < 5 cm) across 14 species in subtropical forests in Tiantong National Forest Park in Eastern China. View in new window/tab. |
| Table 2. Best fitted species-specific regression models for the prediction of aboveground biomass of shrubs and small trees (DBH < 5 cm) across 14 species in subtropical forests in Tiantong National Forest Park in Eastern China. Parameters and statistical criteria are shown for the best fitted model. | ||||
| Species | Species-specific aboveground biomass model | R2 | AIC | CF |
| Adinandra millettii | 1 Ln(AGBp) = –10.7 + 2.50×Ln(D)+12.5×BD 2 Ln(AGBp) = –3.83 + 1.99×Ln(D)+0.860×Ln(H) | 0.96* 0.99** | 6.63 –1.98 | 1.06 1.01 |
| Camellia fraterna | 1 Ln(AGBp) = –3.54 + 2.33×Ln(D) 2 Ln(AGBp) = –4.03 + 1.16×Ln(H)+2.15×Ln(D) | 0.87*** 0.99** | 11.82 –12.18 | 1.12 1.00 |
| Castanopsis carlesii | 1 Ln(AGBp) = –1.70 + 1.18×Ln(D)+0.634×Ln(PrC) 2 Ln(AGBp) = –1.66 + 1.34×Ln(D)–0.21×Ln(H)+0.64×Ln(PrC) | 0.70** 0.67** | 52.39 54.34 | 1.94 2.05 |
| Cyclobalanopsis glauca | 1 Ln(AGBp) = –17.4 + 0.141×Ln(D)+21.6×BD 2 Ln(AGBp) = –3.55 + 2.01×Ln(D)+0.867×Ln(H) | 0.99* 0.99* | –13.02 –11.02 | 1.00 1.00 |
| Cyclobalanopsis stewardiana | 1 Ln(AGBp) = –3.67 + 3.07×Ln(D) 2 Ln(AGBp) = –3.86 + 3.36×Ln(H)–0.307×Ln(CA) | 0.98** 0.99** | 1.01 –2.33 | 1.02 1.01 |
| Diospyros kaki | 1 Ln(AGBp) = –2.80 + 1.64×Ln(D) 2 Ln(AGBp) = –5.57 + 1.89×Ln(D)+1.16×Ln(H)+2.72×BD | 0.70* 0.99* | 6.85 –22.25 | 1.05 1.00 |
| Eurya nitida | 1 Ln(AGBp) = –3.59 + 2.47×Ln(D) 2 Ln(AGBp) = –3.86 + 1.99×Ln(D)+0.95×Ln(H) | 0.99*** 0.99*** | –10.07 –19.35 | 1.01 1.00 |
| Eurya rubiginosa | 1 Ln(AGBp) = –3.42 + 2.22×Ln(D) 2 Ln(AGBp) = 8.92–0.71×Ln(D)–1.06×Ln(H)+1.10×Ln(PrC)- 16.1×BD | 0.59* 0.99* | 24.10 22.78 | 1.72 1.03 |
| Loropetalum chinense | 1 Ln(AGBp) = –9.50 + 2.70×Ln(D)+10.0×BD 2 Ln(AGBp) = –8.93 + 1.95×Ln(D)+0.769×Ln(H)+8.76×BD | 0.76* 0.83* | 20.63 19.50 | 1.20 1.16 |
| Machilus thunbergii | 1 Ln(AGBp) = –3.51 + 2.59×Ln(D) 2 Ln(AGBp) = –3.14 + 2.49×Ln(D)–0.875×Ln(H)+0.503×Ln(CA) | 0.99*** 0.99* | –5.51 –6.80 | 1.01 1.01 |
| Quercus fabri | 1 Ln(AGBp) = –10.9 + 0.753×Ln(CA)+14.8×BD 2 Ln(AGBp) = –13.5 + 1.15×Ln(D)+0.346×Ln(CA)+18.2×BD | 0.68* 0.82* | 33.54 30.58 | 2.11 1.68 |
| Schima superba | 1 Ln(AGBp) = –3.74 + 2.79×Ln(H) 2 Ln(AGBp) = –3.68 + 3.08×Ln(H)–0.361×Ln(CA) | 0.84* 0.87* | 11.41 12.20 | 1.11 1.12 |
| Symplocos setchuensis | 1 Ln(AGBp) = –5.62 + 3.24×Ln(H)+2.06×BD 2 Ln(AGBp) = –4.77–0.384×Ln(D)+3.72×Ln(H) | 0.79* 0.79* | 16.02 15.99 | 1.13 1.13 |
| Symplocos stellaris | 1 Ln(AGBp) = –3.63 + 2.66×Ln(D) 2 Ln(AGBp) = –3.25 + 3.84×Ln(D)–1.66×Ln(H) | 0.99*** 0.99** | 1.88 –6.36 | 1.02 1.01 |
| AGBp, predicted aboveground biomass (kg); Ln, natural logarithm; H, total height (m); D, diameter of the longest stem (cm); CA, crown area (m2); BD, basic density (g cm–3); PrC, parabolic crown variable (m3). R2, coefficient of determination are indicated with asterisks if statistically significant. *: p < 0.05; **: p < 0.01; ***: p < 0.001) PMSE, predictive mean squared error; CF, correction factor; AIC, Akaike information criterion 1) Single-variable with or without BD-CS best fitted model (inclusion of BD and/or CS, if it improves the model capacity) 2) Multiple-variable best fitted model i.e., combination of two or three variables (inclusion of BD and/or CS , if it improves the model capacity) | ||||
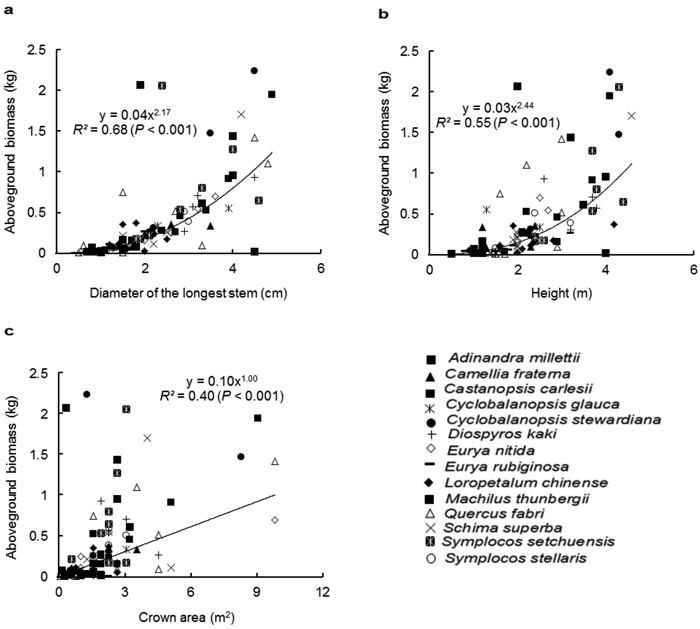
Fig. 1. Relationship between the aboveground biomass (kg) and (a) diameter of the longest stem (D, cm), (b) height (H, m) and (c) crown area (CA, m2), for all shrub and small tree species. Different symbols represent individual species, whereas the trend line represents power function (Y = aXb).
| Table 3. Best fitted multispecies regression models for the prediction of aboveground biomass of shrubs and small trees (DBH < 5 cm) across 14 species in subtropical forests in Tiantong National Forest Park in Eastern China. Parameters and statistical criteria are shown for the best fitted model (n = 96). | ||||
| Multispecies aboveground biomass model | R2 | PMSE | AIC | CF |
| 1 Single-variable with or without BD-CS model | ||||
| a) Ln(AGBp) = –3.23 + 2.17×Ln(D) | 0.68*** | 0.82 | 250.70 | 1.46 |
| b) Ln(AGBp) = –4.97 + 2.20×Ln(D)+3.06×BD | 0.70*** | 0.79 | 247.68 | 1.45 |
| 2 Two-variable with or without BD-CS model | ||||
| a) Ln(AGBp) = –3.50 + 1.65×Ln(D)+0.842×Ln(H) | 0.71*** | 0.75 | 244.48 | 1.42 |
| b) Ln(AGBp) = –5.40 + 1.65×Ln(D)+0.885×Ln(H)+3.31×BD | 0.73*** | 0.72 | 240.09 | 1.34 |
| 3 Multiple-variable with or without BD-CS model | ||||
| a) Ln(AGBp) = –3.43 + 1.50×Ln(D)+0.782×Ln(H)+0.16×Ln(CA) | 0.71*** | 0.79 | 244.72 | 1.42 |
| b) Ln(AGBp) = –5.29 + 1.52×Ln(D)+0.83×Ln(H)+0.145×Ln(CA)+3.23×BD | 0.73*** | 0.74 | 240.54 | 1.40 |
| AGBp, predicted aboveground biomass (kg); Ln, natural logarithm; H, total height (m); D, diameter of the longest stem (cm); CA, crown area (m2); BD, basic density (g cm–3). R2, coefficient of determination are indicated with asterisks if statistically significant. *: p < 0.05; **: p < 0.01; ***: p < 0.001). PMSE, predictive mean squared error; AIC, Akaike information criterion; CF, correction factor a) Single-variable or multiple-variable models without BD or CS b) Single-variable or multiple-variable models with BD or CS | ||||