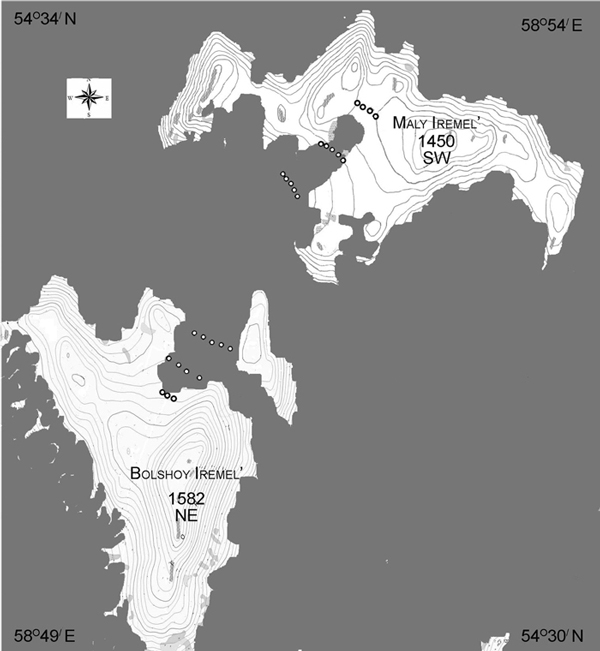
Fig. 1. Study area in the southern Ural Mountains, Russia. Northeast (NE, Bolshoy Iremel) and southwest (SW, Maly Iremel) exposures, plots (сircles) at three elevational levels per exposure from closed canopy forest to treeline were sampled. Continuous forest cover in grey.
| Table 1. General characteristics of the study sites. | ||||||
| Site name | Mt. Bolshoi Iremel (NE exposure) | Mt. Maly Iremel (SW exposure) | ||||
| NE1 | NE2 | NE3 | SW1 | SW2 | SW3 | |
| Elevation in m above sea level | 1365 | 1335 | 1290 | 1360 | 1310 | 1260 |
| Number of plots | 3 | 4 | 5 | 4 | 5 | 5 |
| Tree cover in % | 10 | 25 | 48 | 5 | 30 | 50 |
| Number of trees sampled | 18 | 260 | 261 | 11 | 94 | 139 |
| Mean tree height in m | 2.5 ± 0.2 | 5.3 ± 0.1 | 5.2 ± 0.2 | 1.7 ± 0.2 | 3.3 ± 0.2 | 5.3 ± 0.2 |
| Maximum tree height | 4.3 | 7.5 | 11.0 | 4.1 | 9.2 | 13.0 |
| Mean tree diameter at breast height in cm | 3.6 ± 0.5 | 2.4 ± 0.4 | 12.3 ± 0.6 | 3.1 ± 0.6 | 7.5 ± 0.5 | 10.4 ± 0.6 |
| Maximum tree diameter at breast height in cm | 11.0 | 31.0 | 32.0 | 11.8 | 27.4 | 36.6 |
| Mean tree age in years | 72 ± 8 | 70 ± 4 | 80 ± 3 | 38 ± 4 | 48 ± 3 | 74 ± 3 |
| Maximum tree age in years | 116 | 290 | 211 | 72 | 105 | 124 |
| NE = northeast, SW = southwest | ||||||
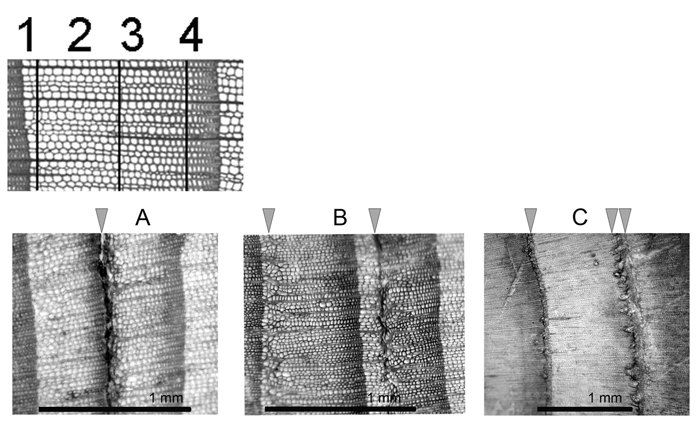
Fig. 2. Growth periods (GP) of an annual ring, growing from left to right. The position of frost damage can be used as an indicator for the seasonal driver of frost events. Frost damage in early spring would register in the beginning of earlywood (1, A, C). Late frost events can further register in the first half of the earlywood (2, B). Frost events in the second half of earlywood might be mid-season frosts (3, B). Early frost at the end of the growing season would result in a frost ring in the latewood (4, C).
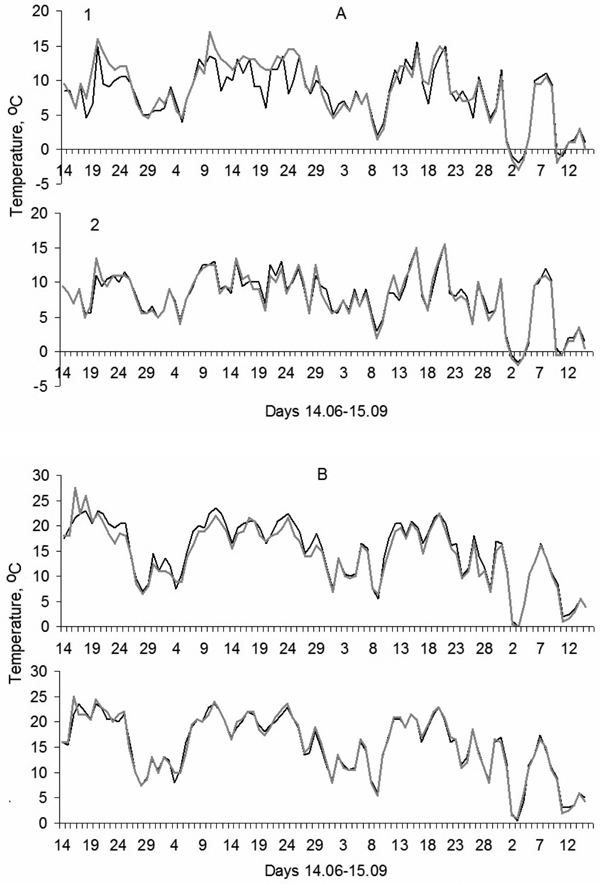
Fig. 3. Daily minimum (A) and maximum (B) temperatures in 2008 at the highest elevation at treeline (1) and in continuous forest (2) on the southwest (black) and northeast (grey) -facing slopes.
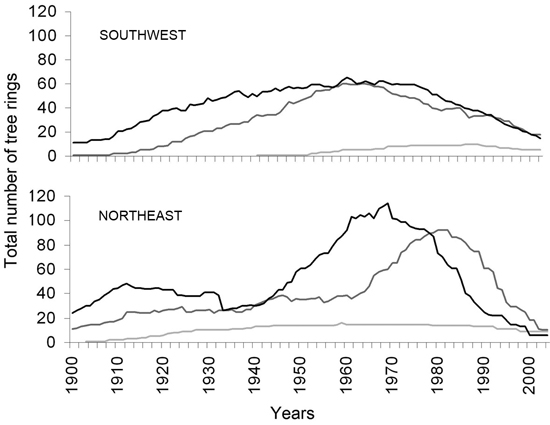
Fig. 4. Sample depth of trees contributing to our analysis by exposure. Lowest elevational level with continuous forest cover (dark line), middle elevational level (middle gray line), and highest elevational level at treeline (light lower gray line). Sample size is largest in the middle of the record and decreases sharply at the end, sample size is lowest at highest elevations due to lower tree density in our area based plot design.
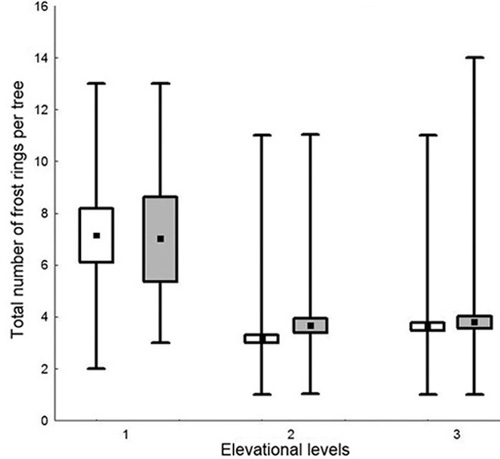
Fig. 5. Frost ring number per tree on the northeast (white boxes) and southwest (grey boxes) exposures. Mean value (black square), standard error (rectangle box), min-max values (whiskers). On average more frost rings occurred higher up the slope at elevational level 1 (treeline), compared to mid slope (2) and continuous forest cover (3).
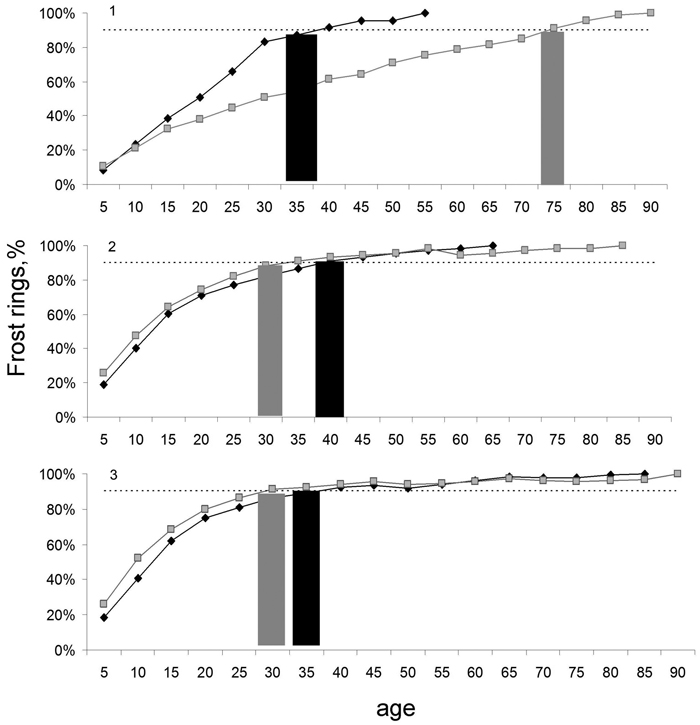
Fig. 6. Effect of slope exposure and tree age on frost sensitivity of spruce. Cumulative amount of frost rings at northeast (grey line with squares) and southwest (black line with diamonds) exposures on three elevational levels (1, 2, 3). Frost-sensitive tree age (northeast grey bar, southwest black bar) defined as the age below which 90% of all frost rings (horizontal line) at that elevation-exposure combination occurred. Most frost rings occurred at an age below 30 years with the exception of the climatically harshest site, the highest elevation on the northeast exposure.
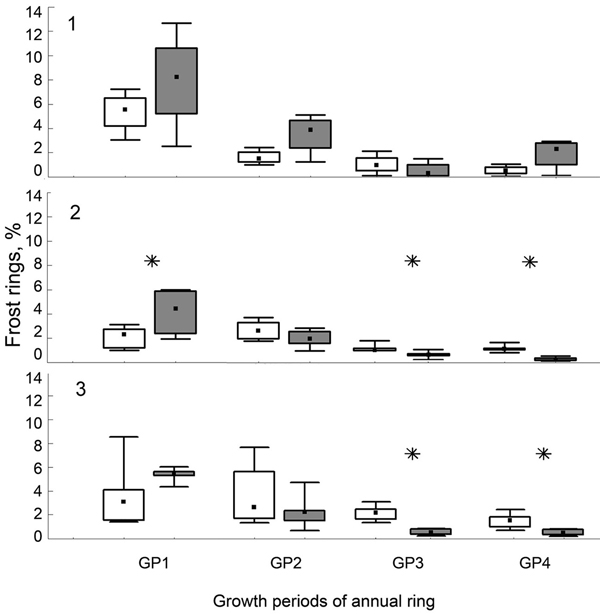
Fig. 7. Percentage of tree rings showing frost events in a particular year from frost sensitive trees (see Fig. 6) on the northeast (white box) and southwest (grey box) exposures, grouped by timing of the frost events. GP (growth periods, 1: early spring to 4: late summer), Median (black square), 25–75% (rectangle box), extreme values (segment), elevational levels (1, treeline; 2, mid elevational slope; 3, continuous forest cover), significant differences between slopes marked by asterisk.
| Table 2. Years of frost ring formation on both slopes (left), or only on one slope (middle part for northeast (NE) and right for southwest (SW) slope). Mean daily temperature from the Taganai-gora weather station. View in new window/tab. |
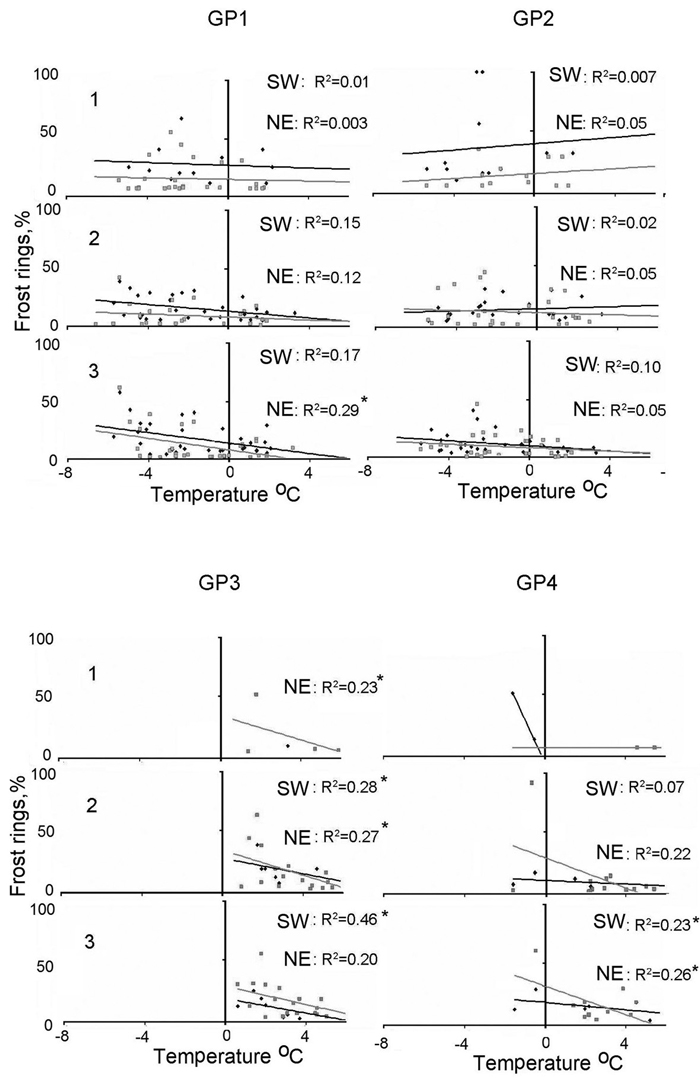
Fig. 8. Correlations between frost ring formation and mean daily temperature at the three elevational levels (1–3), two exposures (NE = northeast, gray square, SW = southwest, black rhomb) are most often not significant. Linear regression line: northeast (grey line), southwest (black line), significant correlations p-value < 0.05 (*). Please note that a mean daily temperature of +2 °C is most likely related to a frost event, since the daily temperature amplitude in those times of the year is about 4 °C. GP1–4 = growth periods from early spring to late summer.