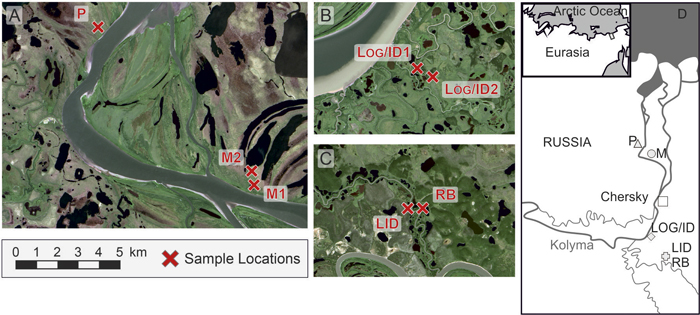
Fig. 1. Locations of the study sites. A) Water disturbed sites in the northern study area, B) Sites influenced by logging and fire, C) Old, low disturbed site LID and water disturbed site in close proximity, D) Regional setting. Site codes: LID = Low Intensity Disturbance, RB = River Bank, Log/ID = Logging/Intense Disturbance 1&2, M = Meander 1&2, P = Polygon.
| Table 1. Larch stand parameters of the different sites. Stand values except for age, height, and diameter at breast height (DBH) have been scaled up to one hectare. Disturbing factor, intensity and transect position indicate the fixed effects used for mixed effect modelling (see Table 2). Site codes: LID = Low Intensity Disturbance, RB = River Bank, Log/ID = Logging/Intense Disturbance 1&2, M = Meander 1&2, P = Polygon. |
| Site | LID | Log/ID1 | Log/ID2 | RB | P | M1 | M2 |
| disturbing factor | fire | new land | water |
| intensity | low | strong | medium |
| transect position | south | middle1 | south | north | middle2 |
| Mean tree height [cm] | 554.8 | 607.9 | 638.1 | 819.7 | 354.3 | 333.2 | 385.6 |
| Mean tree DBH [cm] | 7.6 | 5.0 | 5.4 | 7.2 | 7.2 | 3.8 | 4.8 |
| Mean age (regression) | 213.1 | 37.3 | 37.9 | 59.3 | 57.4 | 67.3 | 44.0 |
| Max. age (measured) | 302 | 44 | na | 70 | 162 | 125 | 161 |
| Max. age (regression) | 386.3 | 44.9 | 45.3 | 69.0 | 162.0 | 124.0 | 160.0 |
| Basal area [m² ha–1] | 6.0 | 20.5 | 19.7 | 25.7 | 0.0 | 1.7 | 1.6 |
| Crown cover [% ] | 20.9 | 142.4 | 136.8 | 164.5 | 0.0 | 17.4 | 17.8 |
| Total biomass [kgC ha–1] | 9613.2 | 29292.0 | 30071.1 | 38368.9 | 4.7 | 3778.2 | 4593.8 |
| No. alive ha–1 | | | | | | | |
| Trees | 1035.7 | 7343.8 | 6093.8 | 4575.0 | 0.4 | 1125.0 | 615.4 |
| Saplings | 2035.7 | 625.0 | 468.8 | 50.0 | 0.1 | 1625.0 | 519.2 |
| Seedlings | 5500.0 | 4150.0 | 4218.8 | 3800.0 | 0.1 | 825.0 | 153.8 |
| No. dead ha–1 | | | | | | | |
| Trees | 1071.4 | 0.0 | 156.3 | 600.0 | 0.0 | 50.0 | 19.2 |
| Saplings | 35.7 | 281.3 | 117.2 | 275.0 | 0.0 | 50.0 | 19.2 |
| Stumps | 0.0 | 1000.0 | 2695.3 | 0.0 | 0.0 | 175.0 | 38.5 |
| Table 2. Linear mixed models for the different variables. Stand values except for age, height, and diameter at breast height (DBH) have been scaled up to one hectare. Disturbing factor, intensity and transect position indicate the fixed effects. All analyses were conducted on larches only. Site codes: LID = Low Intensity Disturbance, RB = River Bank, Log/ID = Logging/Intense Disturbance 1&2, M = Meander 1&2, P = Polygon. View in new window/tab. |
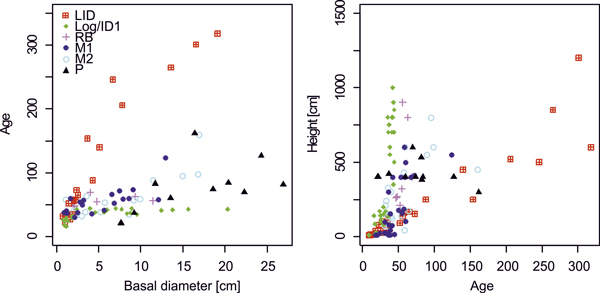
Fig. 2. Age-basal diameter and height-age relationships of larches at differently disturbed sites. Note that age values for the P site (black triangles) are taken from breast height. Site codes: LID = Low Intensity Disturbance, RB = River Bank, Log/ID = Logging/Intense Disturbance 1&2, M = Meander 1&2, P = Polygon.
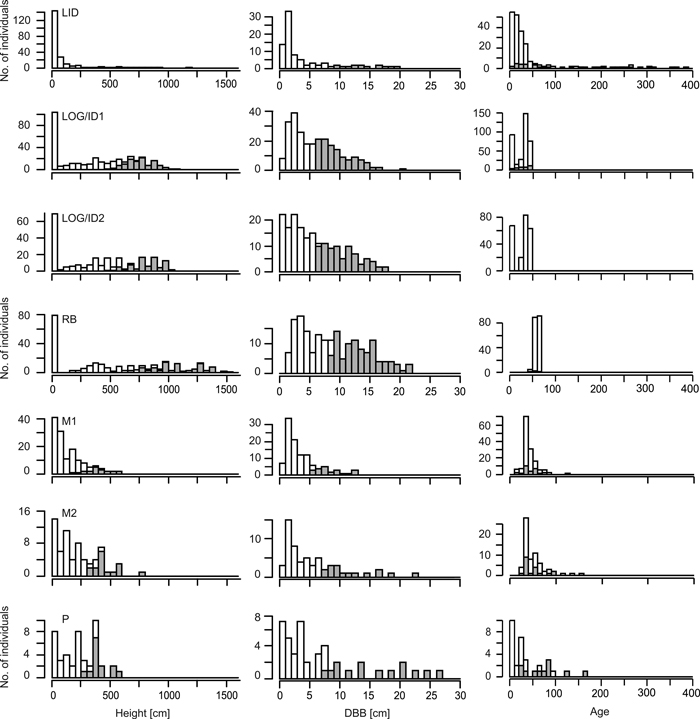
Fig. 3. Stand values of living larches at the seven sites. Height values are given in 50 cm, basal diameter (DBB) in 1 cm and age values in 10 year bins. Grey bars for height and DBB indicate trees with height/DBB > site-specific median of trees. Grey bars for age data indicate measured individuals, while values for white bars are gained by regression analysis (see Suppl. file: Figure S1). Note that age values for the P site are taken from breast height. Note the different y-axes between sites. Site codes: LID = Low Intensity Disturbance, RB = River Bank, Log/ID = Logging/Intense Disturbance 1&2, M = Meander 1&2, P = Polygon
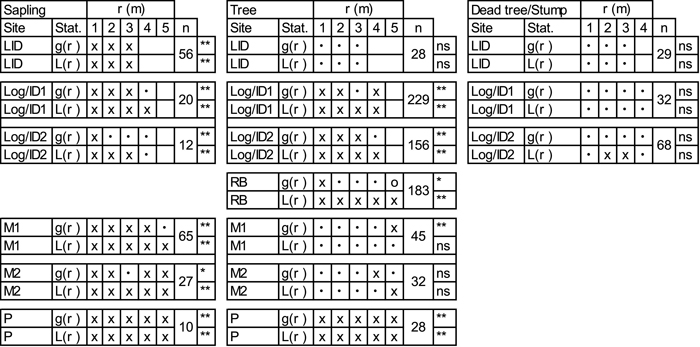
| Table 3. Univariate analyses of living larch saplings (40–200 cm tall), trees (≥200 cm) and dead trees (LID) or stumps (Log/ID) with pair-correlation function (g(r)) and L-transformed Ripley’s K-function (L(r)). Values are given for the pattern at each full metre. For more spatial details, please see Suppl. file: Figures S3–S5. x = clustering at the given scale (1–5m), o = segregation and • = random pattern. Stars indicate goodness-of-fit significance levels: *<0.05, **<0.01; n = number of tested individuals. Site codes: LID = Low Intensity Disturbance, RB = River Bank, Log/ID = Logging/Intense Disturbance 1&2, M = Meander 1&2, P = Polygon. |
 |
| Table 4. Bivariate analyses of trees and saplings, dead trees (LID) or stumps (Log/ID) and saplings and of dead trees (LID) or stumps (Log/ID) and trees with pair-correlation function (g(r)) and L-transformed Ripley’s K-function (L(r)). At site LID, a random labelling approach (rl) was additionally used. Values are given for the pattern at each full metre. For more spatial details, please see Suppl. file: Figures S6–S8. x = clustering at the given scale (1–5m), o = segregation and • = random pattern. Stars indicate goodness-of-fit significance levels: *<0.05, **<0.01. Site codes: LID = Low Intensity Disturbance, RB = River Bank, Log/ID = Logging/Intense Disturbance 1&2, M = Meander 1&2, P = Polygon. |
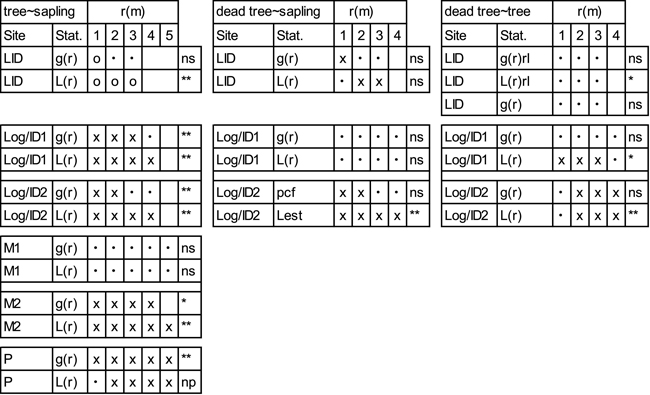 |