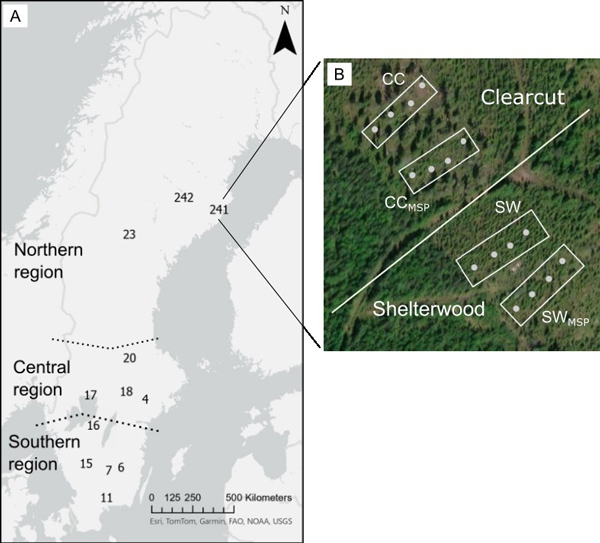
Fig. 1. Picture A shows a map over Sweden and the locations of the sites divided into the three regions, southern, central and northern Sweden. Picture B shows site 24:1 and the experimental design. The whole site equals one block divided into the two main treatments: clearcut (CC) and shelterwood (SW). The main treatments were then further divided into the two sub-treatments: mechanical site preparation (MSP) and no mechanical site preparation (no abbreviation). The four filled circles in the sub-treatments represent the sample plots established in 2022 or 2023.
| Table 1. Description of study sites, using the same regional classification (south, central and north), and site numbers from the original design in Nilsson et al. (2006). | |||||||
| Region | Site | County | Latitude, Longitude | Altitude (m a.s.l.) | Temperature sum (degree-days) | Soil texture | SIS 1 (m) |
| South | 6 | Jönköping | 57°17´N, 15°17´E | 185 | 1385 | Sandy-silty | 26–27 (SP) |
| South | 7 | Kronoberg | 57°08´N, 14°49´E | 230 | 1400 | Sandy-silty | 25–26 (SP) |
| South | 11 | Skåne | 56°26´N, 14°20´E | 150 | 1450 | Sandy-silty | 28 (NS) |
| South | 15 | Älvsborg | 57°28´N, 13°08´E | 175 | 1400 | Sandy-silty | 22 (NS) |
| South | 16 | Skaraborg | 58°39´N, 13°47´E | 70 | 1400 | Sandy-silty | 26 (SP) |
| Central | 4 | Södermanland | 59°13´N, 16°49´E | 60 | 1375 | Sandy-silty | 24–27 (SP) |
| Central | 17 | Värmland | 59°25´N, 13°31´E | 90 | 1380 | Sandy-silty | 26 (SP) |
| Central | 18 | Örebro | 59°35´N, 15°27´E | 85 | 1350 | Sandy-silty | 24–26 (SP) |
| Central | 20 | Dalarna | 60°27´N, 15°45´E | 157 | 1222 | Sandy-silty | 23 (NS) |
| North | 23 | Jämtland | 63°44´N, 15°44´E | 290 | 850 | Sandy-silty | 29–21 (SP) |
| North | 24:1 | Västerbotten | 64°04´N, 20°17´E | 145 | 1010 | Sandy | 23 (SP) |
| North | 24:2 | Västerbotten | 64°33´N, 18°24´E | 340 | 810 | Sandy-silty | 20–21 (SP) |
| 1 Site index, estimated from site properties, at experimental establishment, either based on dominant height at age 100 years for Scots pine (SP) or Norway spruce (NS) | |||||||
| Table 2. Site-specific details of forest management operations during the establishment phase (Nilsson et al. 2006). | ||||||
| Site | Clearcut (month, year) | MSP 1 (month, year) | MSP 1 (type) | Planting (month, year) | Seedling type | Seedling age (years) |
| 6 | Oct-94 | Apr-95 | Patch | May-95 | Bare-root | 4 |
| 7 | Mar-95 | Nov-95 | Disc trench. | May-96 | Cont 2 | 1.5 |
| 11 | Sep-95 | Nov-95 | Disc trench. | Jun-96 | Bare-root | 4 |
| 15 | Feb-94 | Sep-94 | Disc trench. | Apr-95 | Bare-root | 4 |
| 16 | Apr-94 | Nov-94 | Disc trench. | May-95 | Cont 2 | 2 |
| 4 | Apr-94 | Oct-95 | Disc trench. | May-96 | Cont 2 | 1 |
| 17 | Dec-94 | Sep-95 | Mound | May-96 | Cont 2 | 1 |
| 18 | Oct-95 | Oct-96 | Disc trench. | May-97 | Cont 2 | 1 |
| 20 | Dec-94 | May-95 | Disc trench. | Jun-95 | Cont 2 | 1.5 |
| 23 | Mar-95 | Jun-96 | Mound | Jun-96 | Cont 2 | 1 |
| 24:1 | Aug-94 | Jul-96 | Disc trench. | Sep-96 | Cont 2 | 1 |
| 24:2 | Jan-95 | Sep-96 | Disc trench. | Jun-97 | Cont 2 | 1 |
| 1 Mechanical site preparation 2 Containerized seedlings | ||||||
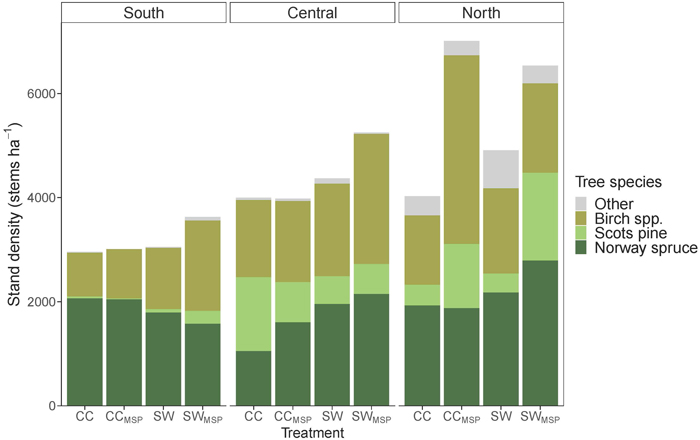
Fig. 2. Stand density (stems ha–1) for the different regions (south, central and north), treatments (CC, CCMSP, SW and SWMSP), and species (Norway spruce, Scots pine, birch spp. and other). The treatments are abbreviated CC = clearcut without mechanical site preparation, CCMSP = clearcut with mechanical site preparation, SW = shelterwood without mechanical site preparation, and SWMSP = shelterwood with mechanical site preparation.
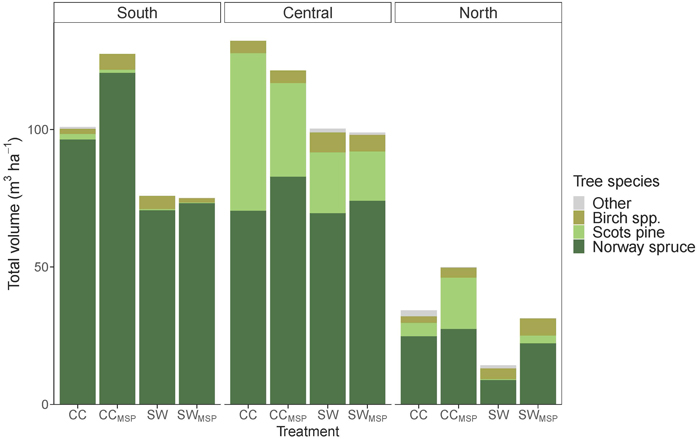
Fig. 3. Total standing volume in m3 ha–1 for the different regions (south, central and north), treatments (CC, CCMSP, SW and SWMSP), and species (Norway spruce, Scots pine, birch spp. and other). The treatments are abbreviated CC = clearcut without mechanical site preparation, CCMSP = clearcut with mechanical site preparation, SW = shelterwood without mechanical site preparation, and SWMSP = shelterwood with mechanical site preparation.
| Table 3. Quadratic mean diameter (QMD) ± SE and Lorey’s mean height (HL) ± SE by region and treatment. The treatments are abbreviated CC = clearcut without mechanical site preparation, CCMSP = clearcut with mechanical site preparation, SW = shelterwood without mechanical site preparation, and SWMSP = shelterwood with mechanical site preparation. | |||||||
| Region | Treatment | QMD (cm) | Lorey’s height (m) | ||||
| Spruce | Pine | Birch spp. | Spruce | Pine | Birch spp. | ||
| South | CC | 10.3 ± 0.9 | 6.4 ± 3.7 | 2.0 ± 0.5 | 10.0 ± 0.9 | 7.4 ± 2.3 | 5.8 ± 1.6 |
| South | CCMSP | 11.4 ± 1.5 | 5.7 ± 3.3 | 4.7 ± 2.2 | 12.1 ± 0.9 | 9.5 ± 4.0 | 6.8 ± 2.4 |
| South | SW | 9.9 ± 1.0 | 2.9 ± 1.0 | 1.8 ± 0.7 | 9.8 ± 0.9 | 4.5 ± 1.4 | 5.2 ± 1.4 |
| South | SWMSP | 9.6 ± 1.1 | 0.6 ± 0.4 | 3.8 ± 1.2 | 9.7 ± 1.1 | 2.4 ± 0.2 | 6.2 ± 1.3 |
| Central | CC | 10.2 ± 2.3 | 11.0 ± 1.0 | 4.3 ± 1.6 | 10.9 ± 1.0 | 10.7 ± 0.8 | 7.3 ± 1.4 |
| Central | CCMSP | 10.3 ± 0.5 | 9.7 ± 0.5 | 2.9 ± 0.5 | 11.0 ± 1.0 | 9.7 ± 1.4 | 6.7 ± 0.7 |
| Central | SW | 9.0 ± 1.1 | 8.4 ± 2.2 | 3.0 ± 1.4 | 10.1 ± 0.8 | 8.5 ± 1.9 | 8.9 ± 1.1 |
| Central | SWMSP | 9.3 ± 1.0 | 7.4 ± 2.1 | 2.0 ± 0.5 | 10.0 ± 0.6 | 8.2 ± 2.0 | 5.1 ± 1.4 |
| North | CC | 6.4 ± 1.3 | 5.3 ± 1.7 | 2.3 ± 0.6 | 7.1 ± 1.1 | 4.8 ± 1.3 | 4.8 ± 1.0 |
| North | CCMSP | 6.9 ± 0.5 | 7.1 ± 1.0 | 1.2 ± 0.3 | 7.0 ± 0.2 | 7.5 ± 0.1 | 3.9 ± 1.2 |
| North | SW | 4.2 ± 0.7 | 1.8 ± 0.1 | 3.4 ± 0.5 | 4.8 ± 0.5 | 2.6 ± 0.1 | 4.8 ± 0.4 |
| North | SWMSP | 5.1 ± 0.5 | 2.5 ± 0.6 | 3.5 ± 0.5 | 6.2 ± 0.7 | 3.8 ± 0.5 | 5.9 ± 0.6 |
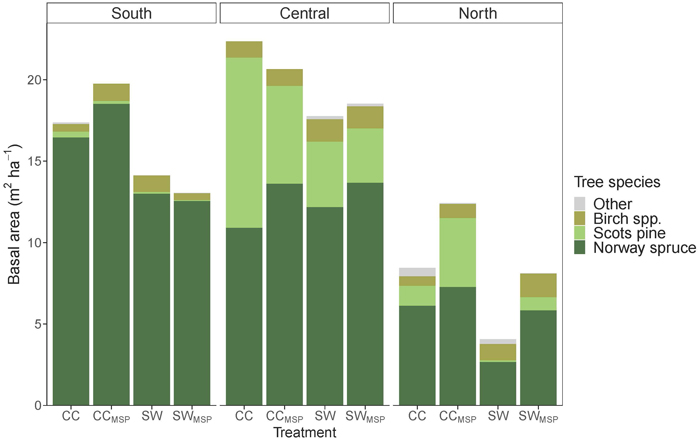
Fig. 4. Total basal area of the new regeneration for sites in southern, central and northern Sweden. The shelterwoods were still retained on the northern sites but were not included in the calculated basal area. The treatments are abbreviated CC = clearcut without mechanical site preparation, CCMSP = clearcut with mechanical site preparation, SW = shelterwood without mechanical site preparation, and SWMSP = shelterwood with mechanical site preparation.
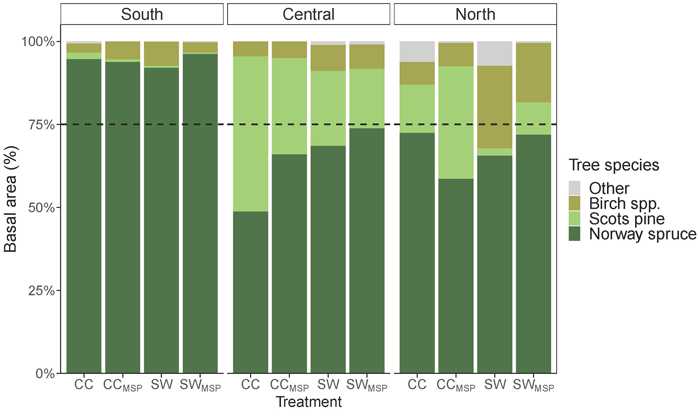
Fig. 5. Basal area divided by region and species in percent. The black dotted line shows the cut-off for mixed species stands (75%). The treatments are abbreviated CC = clearcut without mechanical site preparation, CCMSP
= clearcut with mechanical site preparation, SW = shelterwood without mechanical site preparation, and SWMSP = shelterwood with mechanical site preparation.
| Table 4. The quadratic mean diameter (QMD) for Scots pine and Norway spruce and the QMD ratio for Scots pine vs. Norway spruce for the four central sites. The treatments are abbreviated CC = clearcut without mechanical site preparation, CCMSP = clearcut with mechanical site preparation, SW = shelterwood without mechanical site preparation, and SWMSP = shelterwood with mechanical site preparation. | ||||
| Site | Treatment | QMD (cm) | QMD ratio | |
| Scots pine | Norway spruce | |||
| 4 | CC, CCMSP | 11.1 | 11.5 | 1.0 |
| 4 | SW, SWMSP | 9.9 | 9.0 | 1.1 |
| 17 | CC, CCMSP | 10.6 | 10.9 | 1.0 |
| 17 | SW, SWMSP | 11.3 | 10.5 | 1.1 |
| 18 | CC, CCMSP | 8.8 | 6.8 | 1.3 |
| 18 | SW, SWMSP | 8.4 | 10.8 | 0.8 |
| 20 | CC, CCMSP | 10.8 | 11.9 | 0.9 |
| 20 | SW, SWMSP | 1.8 | 6.3 | 0.3 |
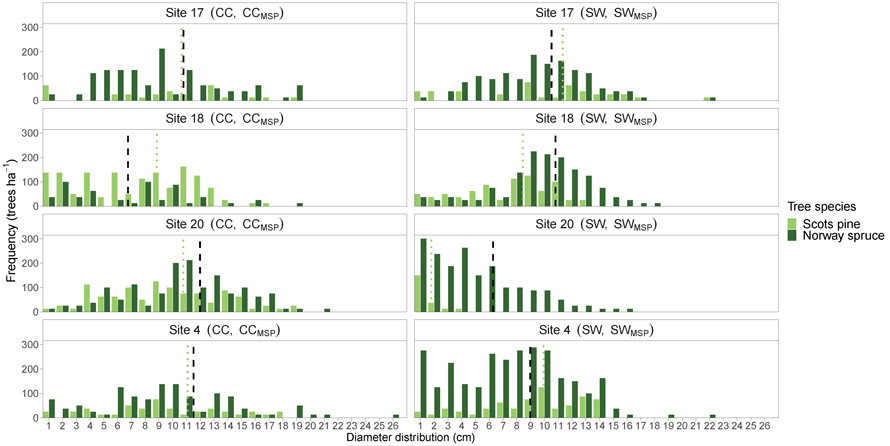
Fig. 6. The diameter distribution of Scots pine and Norway spruce for the clearcut treatments (with and without mechanical site preparation together) and shelterwood treatments (with and without mechanical site preparation together) for the four different sites in central Sweden. The vertical dashed lines represent the mean QMD for Scots pine (dotted, light green) and Norway spruce (dashed, black) for each site. The treatments are abbreviated CC = clearcut without mechanical site preparation, CCMSP = clearcut with mechanical site preparation, SW = shelterwood without mechanical site preparation, and SWMSP = shelterwood with mechanical site preparation. View larger in new window/tab.
| Table 5. Starting values for the different stands and treatments, as well as the simulated thinnings and ages at final harvest for the three different interest rates (IR). The values are shown per hectare. The treatments are abbreviated CC = clearcut without mechanical site preparation, CCMSP = clearcut with mechanical site preparation, SW = shelterwood without mechanical site preparation, and SWMSP = shelterwood with mechanical site preparation. View in new window/tab. |
| Table 6. The financial outcome of the shelterwood by region (south and central) compared to the financial outcome of clearcutting in EUR ha–1 together with the mean and standard errors for the region. A positive number meant shelterwood was more profitable than clearcutting, whereas a negative number indicates that clearcutting was more profitable. | |||||||
| South | |||||||
| IR | Site | Mean | SE | ||||
| 6 | 7 | 11 | 15 | 16 | |||
| CF 0% | 1042 | 474.5 | 731.3 | 831.4 | –162.5 | 583.4 | 207.6 |
| LEV 2.5% | –873.0 | –1424.9 | –1776.4 | –654.7 | –2659.0 | –1478.4 | 355.7 |
| LEV 4% | –1797.5 | –2341.8 | –2987.0 | –1372.1 | –3864.4 | –2472.5 | 440.8 |
| Central | |||||||
| IR | Site | Mean | SE | ||||
| 4 | 17 | 18 | 20 | ||||
| CF 0% | 484.0 | 1318.8 | 305.4 | 752.1 | 715.0 | 221.2 | |
| LEV 2.5% | –1429.3 | –1041.1 | –2113.0 | –1328.2 | –1477.9 | 227.1 | |
| LEV 4% | –2352.9 | –2180.5 | –3280.5 | –2332.5 | –2536.6 | 251.0 | |
| Table 7. Financial results of the simulated full rotation in EUR ha–1 with moderate wind damage. For IR 0%, cash flow (CF) is shown, whereas land expectation value (LEV) is shown for IR 2.5% and 4%. | ||||||||
| South | Central | |||||||
| IR | CC | CMSP | SW | SWMSP | CC | CMSP | SW | SWMSP |
| CF 0% | 470 | 508 | 415 | 413 | 493 | 487 | 461 | 472 |
| LEV 2.5% | 4142 | 5120 | 1727 | 1084 | 5896 | 4820 | 2809 | 2339 |
| LEV 4% | 118 | 430 | –2767 | –3250 | 1055 | 333 | –2313 | –2801 |