| Table 1. Stand characteristics before selective (Sel) and boom-corridor (BCT) thinning treatments. Dbh = diameter at breast height (1.3 m). The thinning treatments are described in Table 2. View in new window/tab. |
| Table 2. Definitions of thinning treatments in the experiments. In all treatments, the width of the strip road was between 4.0–4.5 m, and the strip roads were pre-marked in the centre of the plot. In selective thinning (Sel) treatments, the areas between strip roads were thinned from below, where primarily, the smallest, poorer and possibly damaged trees were removed. In systematic boom-corridor (BCTp, BCTf) treatments, 2.5-m-wide corridors, with 7 m between the machine position, were harvested. In all BCT treatments, the areas between the corridors were left untreated. | |
| Treatment | Definition |
| Sel1 | Selective thinning. Pre-clearing of undergrowth was not needed. |
| Sel2 | Selective thinning, pre-cleared. The undergrowth hindering harvester work was removed before test cutting. |
| BCTp | Completely systematic perpendicular boom-corridor thinning. Pre-clearing of undergrowth was not needed. Corridors 90o from each machine position were harvested. The trees to be removed from the corridors were marked with a sign. |
| BCTf | Completely systematic fan-shaped boom-corridor thinning. Pre-clearing of undergrowth was not needed. Corridors 30o from each machine position were harvested. The opposite corridors of the machine positions were staggered at 2 m. The trees to be removed from the corridors were marked with a sign. |
| BCTsemi1 | Semi-selective boom-corridor thinning. Pre-clearing of undergrowth was not needed. In the middle of the plot, the advisory corridor locations on opposite sides of the strip road were marked. The width and distance of the corridors were, on average, the same as in BCTp and BCTf. The operator chose the exact location of the corridors based on the standing trees. The trees to be removed from the corridors were not marked. |
| BCTsemi2 | Semi-selective boom-corridor thinning, pre-cleared. The undergrowth hindering harvester work was removed before test cutting. In the middle of the plot, the advisory corridor locations on opposite sides of the strip road were marked. The width and distance of the corridors were, on average, the same as in BCTp and BCTf. The operator chose the exact location of the corridors based on the standing trees. The trees to be removed from the corridors were not marked. |
| BCTsemi3 | Semi-selective boom-corridor thinning, pre-cleared. The undergrowth hindering harvester work was removed before test cutting. In the middle of the plot, the advisory corridor locations on opposite sides of the strip road were marked. The width and distance of the corridors were, on average, the same as in BCTp and BCTf. The operator chose the exact location of the corridors based on the standing trees. The trees to be removed from the corridors were not marked. |
| BCTsel | Selective boom-corridor thinning. Pre-clearing of undergrowth was not needed. The width and distance of the corridors were, on average, the same as in BCTp and BCTf. The operator independently chose the location of the corridors based on the standing trees. |
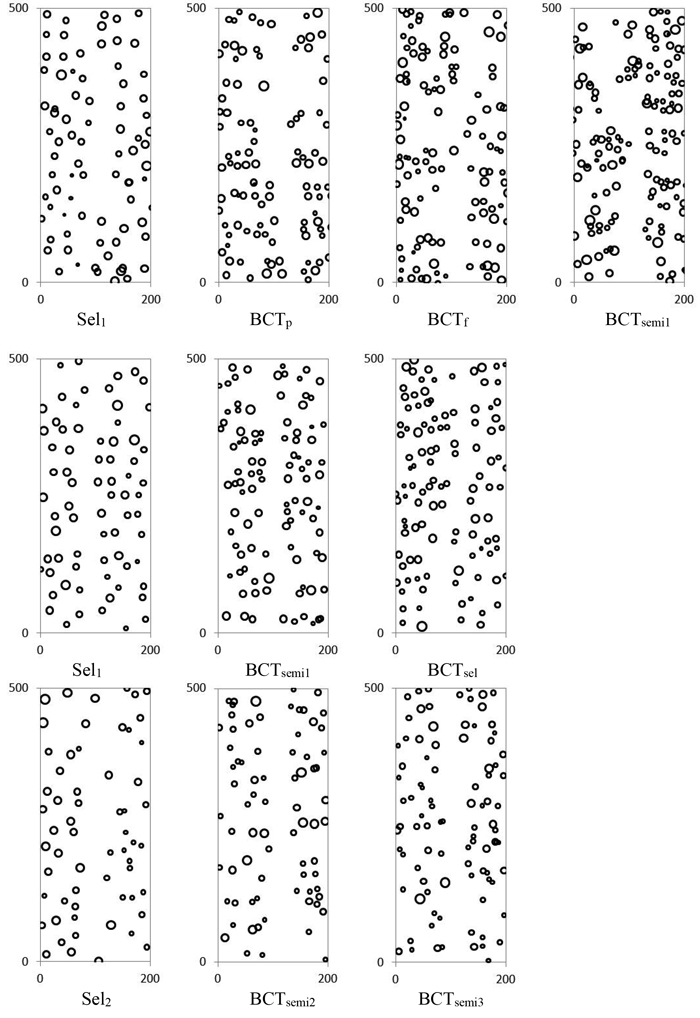
Fig. 1. Examples of tree maps of plots on which selective (Sel) and boom-corridor (BCT) thinning treatments were performed in the pine stands in the seeded pine stand (top) and planted pine stand (middle) and in the planted birch stand (down). The strip road was placed approximately in the middle of the shorter sides of the plot. The width of the circle is proportional to the tree diameter at breast height. The thinning treatments are described in Table 2.
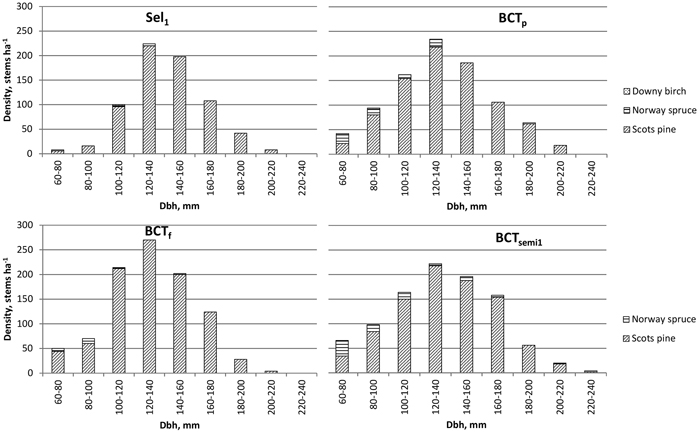
Fig. 2. Average diameter distribution of remaining trees on all plots after selective (Sel) and boom-corridor (BCT) thinning treatments in the pine stand in the seeded pine stand. The thinning treatments are defined in Table 2. View larger in new window/tab.
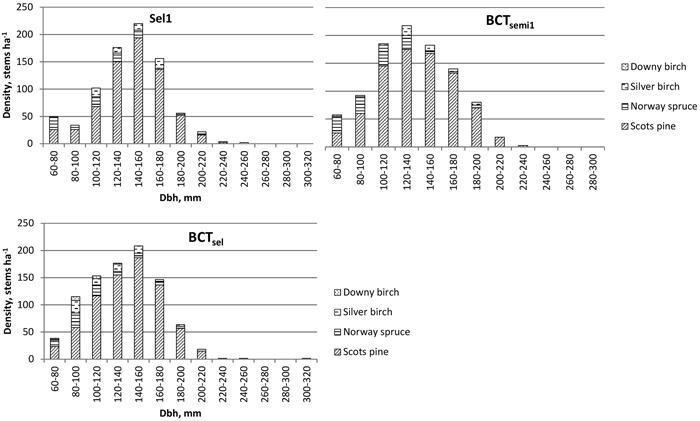
Fig. 3. Average diameter distribution of remaining trees on all plots after selective (Sel) and boom-corridor (BCT) thinning treatments in the pine stand in the planted pine stand. The thinning treatments are defined in Table 2. View larger in new window/tab.
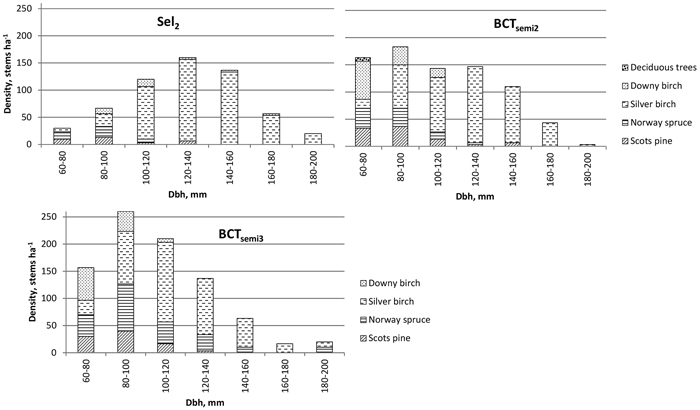
Fig. 4. Average diameter distribution of remaining trees on all plots after selective (Sel) and boom-corridor (BCT) thinning treatments in the birch stand in the planted birch stand. The thinning treatments are defined in Table 2. View larger in new window/tab.
| Table 3. Stand characteristics after selective (Sel) and boom-corridor (BCT) thinning treatments. Dbh = diameter at breast height (1.3 m). The thinning treatments are described in Table 2. View in new window/tab. |
| Table 4. Clark-Evans index R and a two-sided test on the clustering (R < 1) or regularity (R > 1; p < 0.01 in bold) of the spatial distribution of remaining trees on selectively (Sel) and boom-corridor (BCT) thinned plots. The thinning treatments are described in Table 2. | ||||||||
| Experiment | Clark-Evans index R after thinning treatment | |||||||
| R | p-value | R | p-value | R | p-value | R | p-value | |
| Seeded pine stand | Sel1 | BCTp | BCTf | BCTsemi1 | ||||
| Plot 1 | 1.35 | <0.01 | 1.08 | 0.14 | 1.06 | 0.22 | 1.01 | 0.97 |
| Plot 2 | 1.30 | <0.01 | 1.03 | 0.65 | 1.06 | 0.30 | 1.05 | 0.38 |
| Plot 3 | 1.32 | <0.01 | 1.05 | 0.41 | 1.02 | 0.70 | 1.18 | <0.05 |
| Plot 4 | 1.16 | <0.05 | 1.04 | 0.55 | 1.08 | 0.19 | 1.13 | <0.05 |
| Plot 5 | 1.20 | <0.01 | 0.94 | 0.35 | 1.00 | 0.95 | 0.98 | 0.72 |
| Planted pine stand | Sel1 | BCTsemi1 | BCTsel | |||||
| Plot 1 | 1.32 | <0.01 | 1.07 | 0.19 | 1.18 | <0.01 | ||
| Plot 2 | 1.33 | <0.01 | 1.11 | 0.10 | 1.21 | <0.01 | ||
| Plot 3 | 1.25 | <0.01 | 1.22 | <0.01 | 1.12 | <0.05 | ||
| Plot 4 | 1.16 | 0.01 | 1.10 | 0.06 | 1.17 | <0.01 | ||
| Plot 5 | 1.23 | <0.01 | -- | 1.09 | 0.11 | |||
| Plot 6 | -- | -- | 1.10 | 0.13 | ||||
| Planted birch stand | Sel2 | BCTsemi2 | BCTsemi3 | |||||
| Plot 1 | 1.30 | <0.01 | 1.13 | 0.05 | 1.04 | 0.50 | ||
| Plot 2 | 1.24 | <0.01 | 1.07 | 0.28 | 1.06 | 0.31 | ||
| Plot 3 | 1.29 | <0.01 | 1.09 | 0.14 | 1.08 | 0.14 | ||
| Table 5. Relative mean stem volume (without top and branches) of the removal of selective thinning (Sel) and boom-corridor thinning (BCT) and relative mean stem volume of trees remaining in Sel and BCT in comparison with the mean stem volume before thinning. The thinning treatments are described in Table 2. | ||||||||||
| No. of plots | Density of removed (stems ha–1) | Volume of removal (m3 ha–1) | Mean stem volume of removal (dm3) | Relative mean stem volume of removal 1 (%) | Relative mean stem volume of growing stock 2 (%) | |||||
| Experiment | Treatment | Mean | ±SE | Mean | ±SE | Mean | ±SE | |||
| Seeded pine stand 3 | Sel1 | 5 | 1028 | 63.1 | 65 | 1.9 | 64 | 3.8 | 100 | 115 |
| BCTp | 5 | 802 | 70.7 | 68 | 4.1 | 85 | 3.2 | 119 | 98 | |
| BCTf | 5 | 836 | 57.3 | 66 | 4.6 | 79 | 4.3 | 122 | 97 | |
| BCTsemi1 | 5 | 776 | 70.2 | 64 | 2.3 | 84 | 6.5 | 119 | 95 | |
| Planted pine stand 3 | Sel1 | 5 | 834 | 62.1 | 56 | 4.5 | 67 | 2.1 | 100 | 120 |
| BCTsemi1 | 4 | 710 | 44.5 | 56 | 4.8 | 79 | 3.6 | 113 | 103 | |
| BCTsel | 6 | 630 | 49.3 | 41 | 3.3 | 66 | 2.0 | 102 | 115 | |
| Planted birch stand 4 | Sel2 | 3 | 2393 | 99.1 | 92 | 10.2 | 39 | 3.5 | 100 | 120 |
| BCTsemi2 | 3 | 1563 | 128.1 | 62 | 8.1 | 41 | 8.1 | 108 | 102 | |
| BCTsemi3 | 3 | 1770 | 106.9 | 69 | 4.5 | 39 | 2.3 | 117 | 107 | |
| 1 Ratios of stem volumes of removal of thinning treatments where the reference value (100) is the mean stem volume of selective thinning. 2 Relative mean stem volume remained in treatments by comparison with the mean stem volume before thinning. The reference value (100) is the mean stem volume of each treatment before thinning. 3 dbh ≥ 70 mm. 4 dbh 30–69 mm & dbh ≥ 70 mm. | ||||||||||
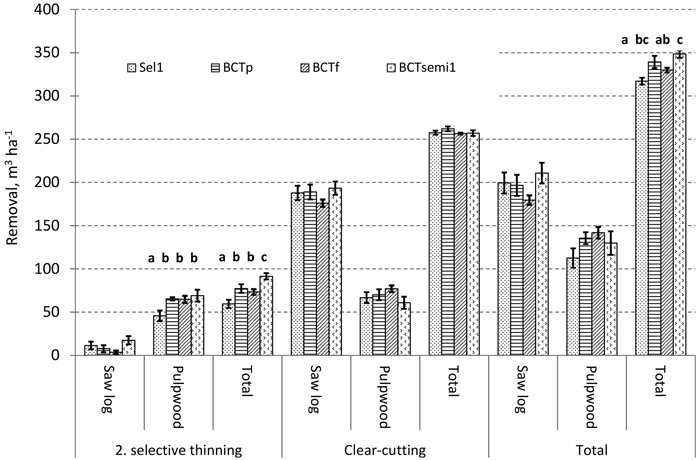
Fig. 5. Simulated removals (Mean ± SE) of the second selective thinning and clearcutting after the first thinning treatments on the treatment plots in the seeded pine stand. The thinning treatments are described in Table 2. Removals marked with different letters are significantly different (p < 0.05).
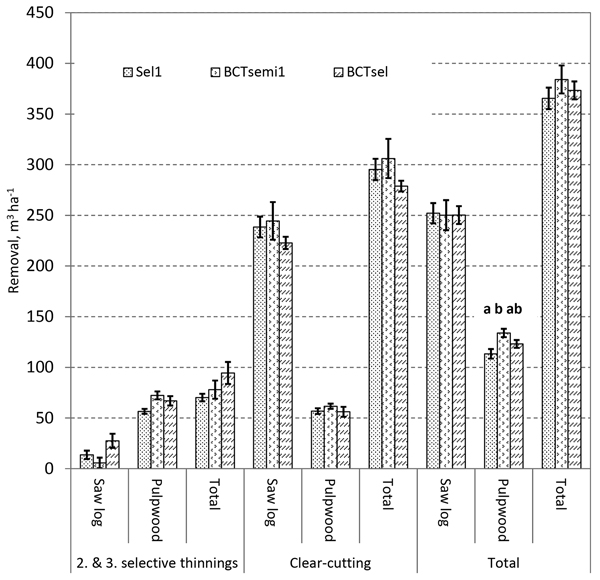
Fig. 6. Simulated removals (Mean ± SE) of the second and third selective thinning and clearcutting after the first thinning treatments on the treatment plots in the planted pine stand. The thinning treatments are described in Table 2. Removals marked with different letters are significantly different (p < 0.05).
| Table 6. Comparison of selective thinning (Sel) and boom-corridor thinning (BCT) done at the first thinning phase. | ||
| Selective thinning | Boom-corridor thinning | |
| Thinning intensity | Thinning intensity varies according to the operator. | Thinning intensity will vary less if the corridor system is designed right. |
| Thinning method | In thinning below, primarily the smallest and poor-quality trees are removed. Quality thinning especially in pine stands. | Does BCT endanger the quality thinning? |
| Stem damage and consequent tree mortality | Will occur especially when the trees are felled to an un-thinned stand area. Depends on the operator and stand structure. | Tree processing takes place in the corridors, increasing stem damage. |
| Soil damage | The tops and branches are processed to the strip road to reduce soil damage. | Are the logging residues sufficiently obtained to the strip road? |
| Cutting and forwarding | Small stem size and low removal per hectare will result in low productivity and high harvesting costs. | The cost-efficiency of cutting and forwarding probably increases. |
| Sequential thinning | Removed trees are larger and more even-sized compared to BCT. | The thinning removal per hectare is higher than in selective thinning stands. |
| Wind and snow damage | Can be reduced by the timing and intensity of the thinning. | Does BCT increase damage risk? |
| Biodiversity | Risk to produce monoculture if the only aim is to maximise saw timber production. Too strong pre-clearing of undergrowth decreases diversity. | BCT gives the opportunity to grow two-storied or uneven forests. BCT creates suitable thickets and game habitats. |
| Pre-clearing | High-quality harvester thinning requires pre-clearing. | Integrated harvesting of energy and pulpwood enables harvester thinning without pre-clearing. |