| Table 1. Silvicultural actions proposed for the two products. |
| TIMBER SCENARIO |
| Age | Operation | Intensity |
| 10 years | pre-commercial thinning | 350 trees/ha, with a density of 500 trees/ha
after this treatment |
| 20 years | pruning | mainly in the lowest branches |
| 40 years | commercial thinning | low thinning, with a density of 225 trees/ha
after this treatment |
| Rotation age (80–150 years) | clearcuts | leaving 10 seed trees by ha |
| CONE/PINE NUT SCENARIO |
| Age | Operation | Intensity |
| 10 years | pre-commercial thinning | 350 trees/ha, with a density of 500 trees/ha
after this treatment |
| 15 years | pruning | lowest branches up to 40–60% of the height |
| 45 years | commercial thinning | low thinning, with a final density of 100 trees/ha
after this treatment |
| Rotation age (80–150 years) | clearcuts | leaving 10 seed trees by ha |
| Table 2. Costs associated with each scenario. |
| TIMBER SCENARIO |
| Year | Operation | Cost |
| following final cutting | fenced to restrict grazing | 1126.16€/ha |
| 10 years | pre-commercial thinning | 285 €/ha |
| 20 years | pruning and removal of fence | 552.62 €/ha |
| 40 years | commercial thinning | 598 €/ha |
| CONE/PINE NUT SCENARIO |
| Year | Operation | Cost |
| following final cutting | fenced to restrict grazing | 1126.16€/ha |
| 10 years | pre-commercial thinning | 285 €/ha |
| 15 years | pruning | 440 €/ha |
| 20 years | removal of fence | 112.62€/ha |
| 45 years | commercial thinning | 870 €/ha |
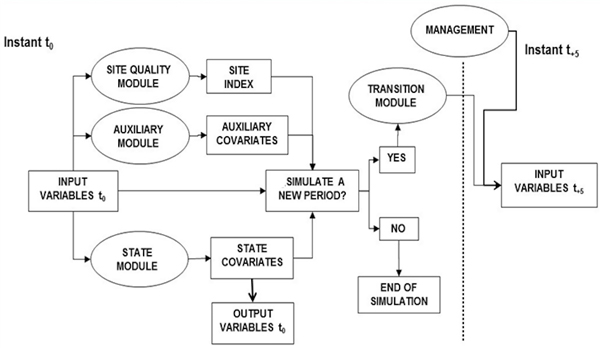
Fig. 1. Flow chart of PINEA2 model.
| Table 4. Forest area oriented towards each silviculture in the mixed scenario. |
| | NPVT | NPVPN | NPV | TH | YPN | Volume control | Regulation | Ending forest inventory |
| Area orientated to timber silviculture | 918.9 | 0.0 | 366.0 | 579.5 | 0.0 | 965.9 | 1093.6 | 777.3 |
| Area orientated to pine nut silviculture | 477.6 | 1396.5 | 1030.5 | 817.1 | 1396.5 | 430.6 | 302.9 | 619.2 |
| Table 5. Solutions obtained using the goal programming method. |
| | TIMBER SCENARIO | CONE/PINE NUT SCENARIO | MIXED SCENARIO |
| λ = 1 | λ = 0 | λ = 1 | λ = 0 | λ = 1 | λ = 0 |
| NPV | 782 070.8 | 701 682.8 | 823 957.6 | 823 896.9 | 872 732.3 | 841 638.9 |
| TH | 225 767.7 | 216 817.7 | 232 353.5 | 232 304.2 | 230 030.1 | 255 831.4 |
| YPN | 15 364 450.0 | 16 167 820.0 | 22 078 710.0 | 22 076 390.0 | 21 934 640.0 | 19 512 580.0 |
| Volume control | 0.0 | 1225.1 | 2293.3 | 2293.1 | 0.0 | 838.8 |
| Regulation | 123.6 | 318.8 | 141.8 | 141.8 | 164.7 | 198.8 |
| Ending forest inventory | 4629.9 | 13 079.5 | 47 022.9 | 46 999.3 | 35 780.8 | 48 135.1 |
| Table 6. Area associated with each silviculture varying the parameter λ. |
| | λ = 1 | λ = 0,8 | λ = 0,6 | λ = 0,4 | λ = 0,2 | λ = 0 |
| Area orientated to timber silviculture | 157.1 | 157.0 | 171.9 | 202.7 | 291.5 | 341.0 |
| Area orientated to cone/pine nut silviculture | 1239.5 | 1239.6 | 1224.7 | 1193.8 | 1105.0 | 1055.5 |
| Table 7. Pay-off matrix in timber scenario when the initial constraint of minimum yield of pine nuts has been removed. View in new window/tab. |