Hao Xiong,
Yong Pang  ,
Wen Jia,
Yu Bai
,
Wen Jia,
Yu Bai
Forest stand delineation using airborne LiDAR and hyperspectral data
Xiong H., Pang Y., Jia W., Bai Y. (2024). Forest stand delineation using airborne LiDAR and hyperspectral data. Silva Fennica vol. 58 no. 2 article id 23014. https://doi.org/10.14214/sf.23014
Highlights
- Delineate forest stands by the fusion of airborne LiDAR and hyperspectral data automatically
- The forest height, canopy closure, and species information were taken into account during the delineation process, aligning with forest management in reality
- The delineation accuracy was verified through comparison with three reference data sources commonly used in forest management.
Abstract
Forest stands, crucial for inventory, planning, and management, traditionally rely on time-consuming visual analysis by forest managers. To enhance efficiency, there is a growing need for automated methods that take into account essential forest attributes. In response, we propose a novel approach utilizing airborne Light Detection and Ranging (LiDAR) and hyperspectral data for automated forest stand delineation. Our approach initiates with over-segmentation of the Canopy Height Model (CHM), followed by attribute calculation for each segment using both CHM and hyperspectral data. Two rules are applied to merge homogeneous segments and eliminate others based on calculated attributes. The effectiveness of our method was validated using three types of reference forest stands with two indices: the explained variance (R2) and Intersection over Union (IoU). Results from our study demonstrated notable accuracy, with a R2 of 97.35% and 97.86% for mean tree height and mean diameter at breast height (DBH), respectively. The R2 for mean canopy height is 81.80%, outperforming manual delineation by 7.31% and multi-scale segmentation results by 2.13%. Furthermore, our approach achieved high IoU values, which indicates a strong spatial agreement with manually delineated forest stands and leading to fewer manual adjustments when applied directly to forest management. In conclusion, our forest stand delineation method enhances both internal consistency and spatial accuracy. This method contributes to improving practical performance and forest management efficiency.
Keywords
canopy height model;
automatic delineation;
merge rule;
over-segmentation
-
Xiong,
Institute of Forest Resource Information Techniques, Chinese Academy of Forestry, Beijing 100091, China; Key Laboratory of Forestry Remote Sensing and Information System, National Forestry and Grassland Administration, Beijing 100091, China; School of Geospatial Engineering and Science, Sun Yat-sen University, Zhuhai 519082, China
 https://orcid.org/0000-0003-4432-2485
E-mail
xiongh29@mail2.sysu.edu.cn
https://orcid.org/0000-0003-4432-2485
E-mail
xiongh29@mail2.sysu.edu.cn
-
Pang,
Institute of Forest Resource Information Techniques, Chinese Academy of Forestry, Beijing 100091, China; Key Laboratory of Forestry Remote Sensing and Information System, National Forestry and Grassland Administration, Beijing 100091, China
https://orcid.org/0000-0002-9760-6580
E-mail
pangy@ifrit.ac.cn
- Jia, Institute of Forest Resource Information Techniques, Chinese Academy of Forestry, Beijing 100091, China; Key Laboratory of Forestry Remote Sensing and Information System, National Forestry and Grassland Administration, Beijing 100091, China E-mail jiawen@ifrit.ac.cn
- Bai, Institute of Forest Resource Information Techniques, Chinese Academy of Forestry, Beijing 100091, China; Key Laboratory of Forestry Remote Sensing and Information System, National Forestry and Grassland Administration, Beijing 100091, China E-mail baiyu9224@163.com
Received 8 March 2023 Accepted 19 February 2024 Published 13 March 2024
Views 49781
Available at https://doi.org/10.14214/sf.23014 | Download PDF

Supplementary Files
1 Introduction
Forest stands are defined as forest units with homogeneous internal characteristics such as stand attributes, growing stock characteristics, and treatments, which are distinguishable from adjacent units (Sanchez-Lopez et al. 2018). In forest management inventory, stand-level data may provide a better performance than tree-level data (Koivuniemi and Korhonen 2006). The traditional delineation of forest stands was usually accomplished by visual interpretation based on high-resolution images and field surveys. This process is time-consuming, labor-intensive, and subjective (Diedershagen et al. 2004; Haara and Haarala 2002).
Therefore, some automatically delineating methods based on remote sensing images have been proposed to solve this problem (Kangas and Maltamo 2006). Several automatic or semi-automatic methods for stand delineation have been proposed using satellite remote sensing images. Wulder et al. (2008) evaluated the suitability of IKONOS 1 m spatial resolution panchromatic imagery for stand delineation. Mora et al. (2010) used QuickBird high-resolution panchromatic imagery to establish a stand height regression model based on automatic delineation. In recent years, research on forest stands delineation using airborne remote sensing images is increasing. Leckie et al. (2003) used high-resolution airborne multispectral imagery to extract tree or cluster profiles and then classified them with a maximum likelihood classifier to delineate young coniferous plantation stands. Hernando et al. (2012) used an object-oriented segmentation and classification approach to delineate four bands (red, green, blue, and Near infrared (NIR)) and the Normalized Difference Vegetation Index (NDVI) of aerial orthophotos.
While multispectral image data alone has limitations, Light Detection and Ranging (LiDAR) can supplement it with forest structure information (de Lera Garrido et al. 2020). Mustonen et al. (2008) compared the differences between Canopy Height Model (CHM) and airborne imagery as source data for delineation, and they found that forest stands delineated from CHM were more homogeneous than those from airborne imagery. Koch et al. (2009) proposed a method combining low-density Airborne Laser Scanning (ALS) data with feature extraction, creation, and raster-based classification methods for stand delineation. This method could detect 15 forest types that matched the local ground conditions well, but a major limitation was the inadequate information on tree types. Wu et al. (2013, 2014) extracted the tree size, forest density, and tree species indicators from point cloud, which were used to merge into forest stands with a region-grown method. Then the coarse segmentation results were merged into forest stands using the region growth method. This performance of the forest stands description is improved compared to delineation with only tree size and density information (Tokola et al. 2008). Some new heuristic methods have been tested recently. Pascual et al. (2022) tested the mixed integer programming method for delineation. Pukkala et al. (2021) examined the performance of Kohonen networks for delineation with geographical coordinates as criteria. Sun et al. (2021) tested the simulated annealing metaheuristic using Unmanned Aerial Vehicle Laser Scanning (UAV-LS) attributes. There were also some methods based on LiDAR point clouds, in which the pixel-level results were obtained, and the stands were small and discontinuous (Sanchez-Lopez et al. 2018; Stereńczak et al. 2018).
While some studies used the structural information from the ALS data, several methods with multi-source remote sensing data were also developed. Leppänen et al. (2008) performed multilevel segmentation on the CHM with 1 m spatial resolution, then combined rasterized LiDAR data and color infrared images for finite iterative area growth. Dechesne et al. (2017) generated an object-based feature map by computing attributes from point clouds and multispectral images, followed by utilizing a random forest approach for supervised tree species classification to delineate forest stands. Pukkala (2019a, 2019b, 2020) developed a stand delineating method with cellular automaton using ALS data with 16 m spatial resolution and forest resource survey data. By adjusting the main land types, soil fertility, average diameter at breast height (DBH), average tree height, size, shape, and other parameters within the grid, the delineating results can be modified. Jia et al. (2019) discussed the effect of different shape and area parameters in the cellular automaton stand delineating method and found that the increasing weight of the shape criterion and stand area improved the shape of the stands. Concerning the above existing methods, the comparisons with real forest stands were lack. Moreover, some important attributes for forest managing (e.g., tree species) need to pay more attention. As a complement, airborne hyperspectral imagery has a high spatial and spectral resolution, therefore it has the potential for stand delineation. Numerous studies have shown that airborne hyperspectral data can produce tree species classification results with high accuracy (Dalponte et al. 2012; Dian et al. 2015; Feret and Asner 2012).
Previous studies are limited in fully exploiting the available information within the forest. Specifically, the vegetation spectrum and texture information derived from multi-spectral data lacks forest structure details. Conversely, forest structure information obtained solely from LiDAR data need to integrate forest category details. While other methods integrating multi-spectral and LiDAR data aim to leverage the strengths of both modalities, they do present limitations. These methods typically focus on evaluating the internal consistency and discrepancies among delineated stands using ALS data, often without validation against manually delineated results, which can reduce their practical effectiveness. Additionally, tree species information from multi-spectral data is less precise than hyperspectral data. To address the aforementioned challenges, we propose a method based on airborne LiDAR and hyperspectral data for automatic forest stand delineation. The hyperspectral data provided the dominant tree species of the forest stands. The CHM provided geometric information of forest stands such as mean tree height and density. And two rules we designed took full advantages of the above information and improved the automation of forest stand delineation.
2 Materials and methods
2.1 Study area
The study area is located in the Mengjiagang Forest Farm (MFF), Heilongjiang Province, China (i.e. 130° 32′ 00″ E – 130° 52′ 06″ E, 46° 26′ 20″ N – 45° 30′ 16″ N; Fig. 1). MFF is located in the western foothills of the Wanda Mountains and is dominated by low hills with a relatively gentle slope, ranging from 10° to 20°. The terrain is high in the northeast and low in the southwest, with an average altitude of about 250 m. The major tree species in this farm include Korean pine (Pinus koraiensis Siebold & Zucc.), Spruce (Picea asperata Mast.), Mongolian pine (Pinus sylvestris var. mongolica Litv.), and larch (Larix olgensis A. Henry), which approximately account for 80% of the forest area. There are also some natural forests in the northeast of the farm. For more information on the characteristics of forest stands within the MFF, please refer to Supplementary file S1.
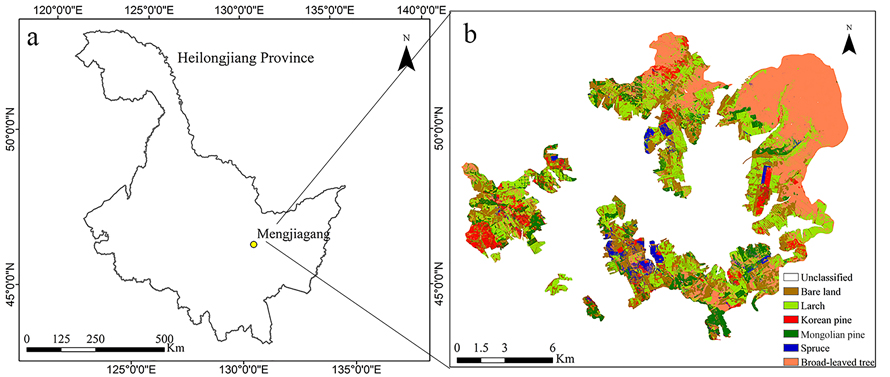
Fig. 1. The general information of study area. (a) Location of the Mengjiagang Forest Farm (MFF) in the Heilongjiang province, China. (b) Tree species map of MFF. View larger in new window/tab.
2.2 Airborne data
The airborne data was collected between 31st May and 15th June 2017 by the CAF-LiCHy system (The Chinese Academy of Forestry’s LiDAR, CCD, and Hyperspectral system) (Pang et al. 2016; Jia et al. 2024). CAF-LiCHy contains LiDAR, Charge-Coupled Device (CCD), and hyperspectral sensors. The airborne LiDAR data were collected using the RIEGL LMS-Q680i laser sensor. The flight altitude was approximately 750 m above mean ground elevation, with a pulse frequency of 300 kHz and a scanning angle of 30°. The ground footprint diameter is about 0.4 m. The average point density range is 3.6 points m–2. The aerial digital camera, a Hasselblad H4D-60, has an in-flight heading and side overlap of 70% and 50%, respectively. It captures a DOM (Digital Orthophoto Map) with a spatial resolution of 0.2 m. The hyperspectral AISA Eagle II sensor has a spectral range spanning from 400 to 990 nm, offering a fine spectral resolution of 9.2 nm across its 64 bands, and providing a spatial resolution of 0.5 m. Besides, the airborne hyperspectral images were resampled to 2 m spatial resolution for tree species classification. The consistent accuracy is about 1 m of the spatial position between LiDAR data, digital orthophotos, and hyperspectral images (Jia and Pang 2023).
2.2.1 Canopy height model
The CHM was obtained from the LiDAR point cloud data using the TerraSolid (2023) software. The noise points were removed and the point cloud was classified into the surface and non-surface points; the Digital Elevation Model (DEM) and Digital Surface Model (DSM) were generated with a spatial resolution of 1 m using the Triangulated Irregular Network (TIN) interpolation algorithm, which incorporates Delaunay triangulation, and the maximum elevation interpolation method, respectively. Then, DSM and DEM were subtracted to obtain CHM.
2.2.2 Tree species map
The tree species classification map was obtained based on airborne hyperspectral images. Eight texture attributes were calculated for each band of the hyperspectral images using the Gray Level Co-occurrence Matrix (GLCM) (Jia and Pang 2023), including mean, uniformity, heterogeneity, correlation, variance, second-order moments, entropy, and contrast. The texture attributes were then processed by the Minimum Noise Fraction (MNF) method to reduce the dimensionality. The narrow band vegetation indices(NDVI705, mSR705, mNDVI705, VOG1, VOG2, REP) (Jia and Pang 2023) were also calculated. The Support Vector Machines (SVM) supervised classification method was performed using the extracted texture information and spectral information (i.e. MNF bands and narrow band vegetation indices). Six categories (i.e. larch, Korean pine, Mongolian pine, spruce, broad-leaved trees, and bare land) were classified across the Mengjiagang Forest Farm, with an overall accuracy of 91.28% and a Kappa coefficient of 0.88.
2.3 Ancillary reference data
Three types of reference forest stands were used to validate our result, which included forest management inventory stands, logging stands, and manual-delineated stands based on 0.2 m spatial resolution DOM.
These forest management inventory stands were obtained by modifying the forest stands of the farm based on our airborne images. The minimum area of the forest management inventory stands was 0.1 hectares. The maximum area of the plantation was 20 hectares, and that of the natural forest was 50 hectares.
The logging stands were delineated according to the demand of logging operations by different types of forest, stand type, age group, canopy density, and management mode. The area of the logging stands ranged from 1 to 17 hectares for a total of 149 stands.
The DOM stands were delineated by distinguishing the areas between different features or forest boundaries in DOM with 0.2 m spatial resolution, and as such 100 stands were delineated.
2.4 Segments generation
The stand delineating method consists of three main steps: (i) the 1 m resolution CHM was down-sampled to 5 m, filtered by a minimum variance filter, and over-segmented to get segments smaller than the forest stand size; (ii) the attributes of segments were calculated, including mean canopy height, canopy closure, dominant tree species, and the proportion of dominant tree species; (iii) two rules (merging homogeneous segments and eliminating small segments) were used to merge segments toward final forest stands. The workflow was presented in Fig. 2.
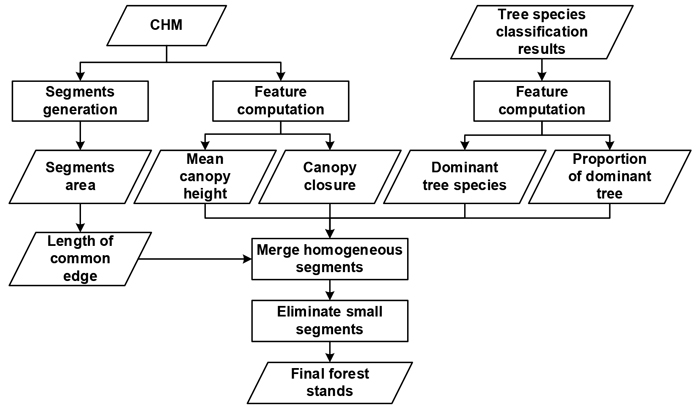
Fig. 2. The flowchart of automatic delineation of forest stands based on canopy height model (CHM) and tree species.
To reduce the noise in homogeneous forest areas, the CHM was down-sampled to 3 m, 5 m, 7 m, and 10 m, respectively, and filtered by four edge-preserving smoothing filters, including the Symmetric Nearest Neighbor (SNN) filter, the K-Nearest Neighbor (KNN) mean filter, the sigma smoothing filter, and the Minimum Variance Filter (MVF). In this study, four window sizes of 3 × 3, 5 × 5, 7 × 7, and 9 × 9 were tested, respectively.
The KNN mean filter selects similar pixels within a range and replaces the center pixel with their mean value. The MVF utilizes templates to replace the center pixel with the gray value from the template with the lowest variance. The sigma smoothing filter replaces the center pixel with the mean of neighboring pixels falling within a confidence range. The SNN filter selects similar pixels within a local range and computes their mean as the target pixel value, while preserving pixels with substantial differences. These filters offer varying degrees of computational efficiency and boundary maintenance while smoothing the image.
The comparative evaluation of these four filters with four window sizes was four window sizes presented in Suppl. file S2. It was observed that the KNN smoothing filter and the sigma smoothing filter led to increased blurring, resulting in inadequate preservation of boundaries between distinct qualitative regions. Conversely, the minimum variance mean filter exhibited superior smoothing performance and effectively maintained boundary integrity, outperforming the SNN filter. As a result, the minimum variance mean filter was chosen as the preferred option for subsequent analysis.
Subsequently, the preprocessed CHM was segmented using object-oriented multiresolution segmentation in the eCognition Developer software (2011). This segmentation separated the heterogeneous parts while retaining areas with similar tree heights and densities.
2.5 Feature computation
Six forest attributes were derived from the CHM and the tree species map, including mean canopy height, canopy closure, dominant tree species and their percentage, stand area, and the length of the common edge.
Canopy closure and mean canopy height of each segment were computed with CHM. Cells with CHM higher than 2 m are considered valid tree cells. Canopy closure was the ratio of valid cells to all the cells in a segment. When there were more than 50% valid cells in a segment, we calculated the average CHM of the valid cells as the mean canopy height. Otherwise, we calculated the mean value of all the cells. In this way, the terrain height would not have a negative effect when calculating the mean canopy height of a segment.
Dominant tree species and their proportion were calculated from the tree species map. Tree proportion was the proportion of one tree species to all the tree species in a segment. The dominant tree species was the species with the highest tree proportion in a segment. We counted all species and their proportion in each segment, then identified the dominant species.
2.6 Merging steps
2.6.1 Merge homogeneous segments
The segments generated by over-segmentation were too small for the forest management implementation. Therefore, they need to be further aggregated to obtain continuous forest stands of suitable sizes (Jia et al. 2019; Pukkala 2019b). They were then merged by our merging-homogeneous-segments rule, with the following equation:
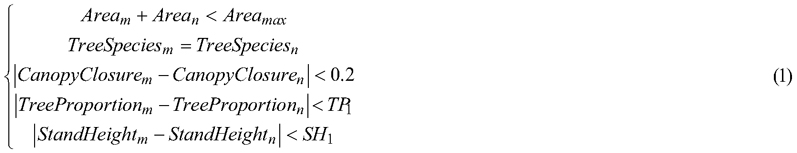
In Eq. 1, m is the segment, and n is one of the neighbors of each m. Segment m will be merged with its neighbor n which meets all the above conditions. If more than one neighbor n meet the above conditions, we will choose the one with the least stand height difference from m. The Areamax is the maximum forest stand area, which comes from existing forest inventory and management standards. In this study, 50 hectares for natural forest and 20 hectares for plantation were used. TP1 is the threshold for the difference in dominant tree proportion. SH1 is the threshold for the difference in mean canopy height between segments and their neighbors. Segments qualified for merging only if their combined area with one of their neighbors did not exceed the Areamax. Moreover, merging required that the difference in tree proportions between the target segment and its neighbors was less than TP1, and the difference between their mean canopy heights was less than SH1.
2.6.2 Eliminate segments
Following the application of the merging-homogeneous-segments rule to all segments, those lacking acceptable neighbors undergo consolidation through the eliminating rule. This rule is designed to merge smaller segments into adjacent stands. Instances arise where certain small segments fail to meet the similarity criteria outlined in the merging-homogeneous-segments rule, yet their area remains below the specified minimum for forest stands. Therefore, the eliminating rule is introduced to merge these undersized segments into neighboring stands wherever possible. The equation is below:
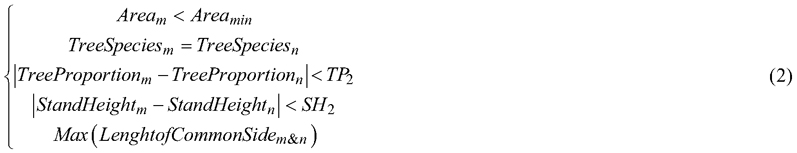
In Eq. 2, m is the segment, and n is one of the neighbors of segment m. A threshold of the minimum stand area Areamin is applied to all segments, and those segments smaller than Areamin will be merged with one of their neighbors. We evaluate in turn whether neighbor n meets the conditions of Eq. 2. Segment m will be merged with its neighbor n which matched the condition. If no neighbor or more than one neighbors match the condition, we will proceed to the next condition to ensure there is neither repetition nor omission. TP2 is tree proportion threshold, which is the difference in dominant tree proportion between segments and their neighbors with the same dominant tree species. SH2 is the stand height threshold, which is the difference in mean canopy height between each segment and its neighbors.
2.6.3 Threshold determination
Before merging the segments, it is necessary to determine the aforementioned threshold values. After over-segmentation, differences in mean canopy height were calculated between each segment and its neighbors. For segments sharing the same dominant tree species with their neighbors, tree species proportion differences were computed. Subsequently, segments located within each manually delineated forest stand (randomly sampled with 95% confidence) were used for comparison. Differences in mean canopy height and dominant tree species proportion between these segments and their neighbors were determined as SH1 and TP1, respectively. SH2 and TP2 were appropriately increased based on SH1 and TP1 to relax the merging criteria.
2.7 Validation
2.7.1 The forest stands of multiresolution segmentation
The forest stands delineated by the traditional multiresolution segmentation method were compared with the forest stands delineated by our method. The traditional multiresolution segmentation was performed on 1 m and 5 m resolution CHM supported by tree species derived from the hyperspectral image. Then the segmentation results were combined and optimized to generate the final forest stands delineation.
2.7.2 Evaluation indicators
The delineating results were verified in two ways. Firstly, the accuracy of the stand boundaries was evaluated, in which three types of reference stands were used: forest management inventory stands, logging stands, and the stands delineated based on 0.2 m spatial resolution DOM. The Intersection over Union (IoU) (Nowozin 2014) was introduced to compare the overlap between automatically delineated stands and reference stands. IoU is the ratio of the intersection area to the union area of the automatic stands and their corresponding reference:

The proportions of the automatic stands with IoU > 0.7, and IoU > 0.5 (Luo et al. 2020) were calculated to assess their consistency with forest management inventory stands.
Secondly, the explained variance of mean DBH, mean tree height, and mean canopy height calculated by CHM of 5 m × 5 m cells was used to evaluate the homogeneity of each forest stand and the heterogeneity between different forest stands (Jia et al. 2019; Pukkala 2019a,b). The variances of each cell within a stand (SSwithin), the sum of variances of each cell within the whole study area (SStotal), and the interpretable variance (R2) of them were calculated with the following equation:
![]()
![]()
![]()
When applied to sample site data, k is the number of forest stands, ni is the number of sample plots in standi, xij is the value of sample plot j in standi, ![]() is the mean value of sample plots in the whole study area, and xi is the mean value of sample plots in standi. When applied to CHM data, k is the number of forest stands, ni is the number of cells in standi, xij is the value of cell j in standi,
is the mean value of sample plots in the whole study area, and xi is the mean value of sample plots in standi. When applied to CHM data, k is the number of forest stands, ni is the number of cells in standi, xij is the value of cell j in standi, ![]() is the mean canopy height of cells in the whole study area, and xi is the mean value of cells in standi. The closer the interpretable variance is to 1, the higher the forest stands consistency is, and the greater the variability among different forest stands is.
is the mean canopy height of cells in the whole study area, and xi is the mean value of cells in standi. The closer the interpretable variance is to 1, the higher the forest stands consistency is, and the greater the variability among different forest stands is.
3 Results
3.1 The delineating results of different scales
The delineating results of different scales were shown in Fig. 3. Fig. 3a, 3c, and 3e were segments, the merged results, and the final stands based on CHM, respectively. Fig. 3b, 3d, and 3f were segments, the merged results, and the final stands based on the tree species map, respectively. The stands with similar tree height, density, dominant tree species and proportion were well merged after the homogeneous merging step. The remaining segments smaller than the threshold were merged according to the other eliminating rule without omission. The final result matched these two maps well and was up to the forest management standard. As shown in Fig. 3a and 3b, the fields with different tree heights and densities were segmented, but their areas were too small to be identified as stands. In Fig. 3c and 3d, most of the merged stands were suitable as forest stands, but small segments remained. In Fig. 3e and 3f, the final delineated stands fitted CHM, and the tree species map well without too small segments.
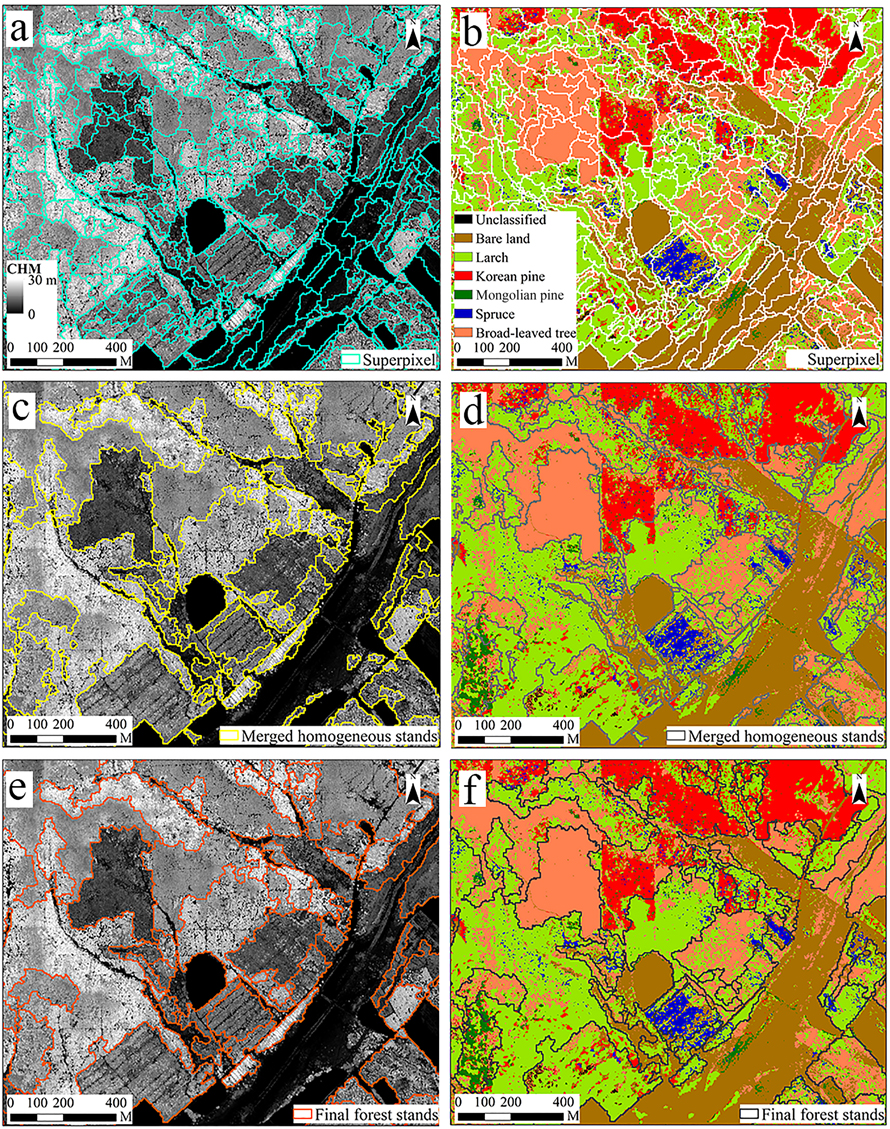
Fig. 3. Segments, merged results and final forest stands based on CHM and tree species map. (a) Segments on CHM, (b) Segments on tree species map, (c) The merged segments on CHM, (d) The merged segments on tree species map, (e) The final forest stands on CHM, (f) The final forest stands on tree species map.
The final automatically delineated stands were compared with the forest management inventory stands in Fig. 4. The red line was the boundary of automatically delineated stands and the blue line was the boundary of forest management inventory stands. The result of our method was generally similar to the forest management inventory stands. The boundaries of automatically delineated stands were more consistent with the real canopy boundaries and tree species distribution than those of forest management inventory stands. Fig. 5 displayed the final forest stands of the whole MFF, which was delineated according to the attributes of the forest.
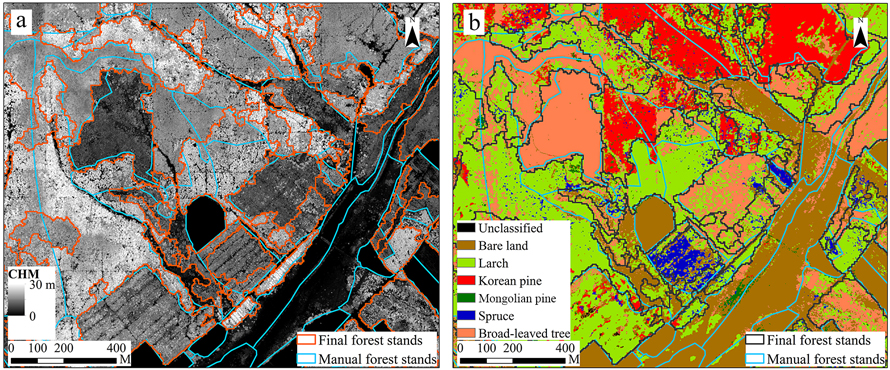
Fig. 4. Comparison of delineated forest stands and forest management inventory stands. (a) The final forest stands (red line) and forest management inventory stands (blue line) on CHM. (b) The final forest stands (black line) and forest management inventory stands (blue line) on tree species map.
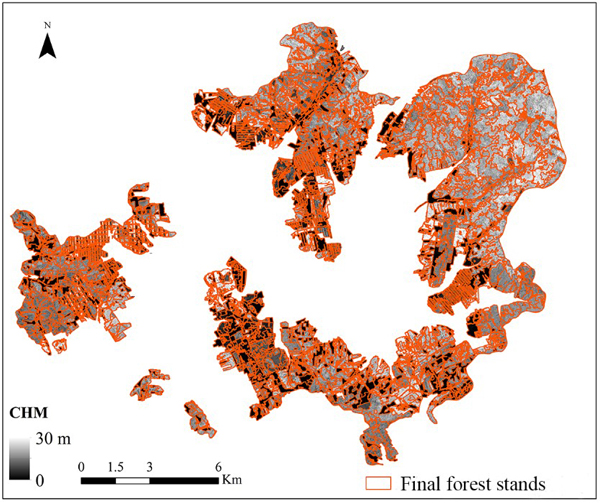
Fig. 5. The final forest stands of the whole MFF forest farm.
3.2 Intersection over union
The proportions of IoU > 0.7 and IoU > 0.5 among the automatically delineated stands and reference stands were shown in Table 1. It also contained the stands generated by the multiresolution segmentation method and reference stands. In the traditional multiresolution segmentation method, the scale parameter of CHM data with 1 m resolution was 37 and that of CHM data with 5 m spatial resolution was 100.
| Table 1. The proportion of Intersection over Union (IoU) > 0.7 and IoU > 0.5 among the stands generated by our stands-delineation method and multiresolution segmentation method with reference stands. | |||||
| Forest stands | Our stands-delineation method | Multiresolution segmentation method | The number of reference forest stands | ||
| The proportion of IoU > 0.7 among the stands (%) | The proportion of IoU > 0.5 among the stands (%) | The proportion of IoU > 0.7 among the stands (%) | The proportion of IoU > 0.5 among the stands (%) | ||
| Forest management inventory stands | 24 | 41 | 46 | 61 | 2285 |
| Logging forest stands | 48 | 67 | 37 | 54 | 148 |
| Forest stands based on Digital Orthophoto Model (DOM) | 64 | 82 | 43 | 55 | 100 |
The IoU score reflected the accuracy of automatically delineated stands in shape and area perspectives. Generally, the results were in good agreement with the reference value when IoU ≥ 0.5 and in very good agreement when IoU ≥ 0.7. So more than half of the automatically delineated stands of this study were in good agreement with the manually delineated stands, and a large proportion of the forest stands were in very good agreement. In summary, the automatically delineated stands were similar to those of manually delineated forest stands, logging forest stands, and DOM-based mapping forest stands.
By comparing the results in Table 1, in terms of consistency with logging stands and DOM-based mapping stands, the proportions of IoU > 70% and IoU > 50% in forest stands delineated by our method were higher than those obtained by the multiresolution segmentation method. The similarity between the multiresolution segmentation results and three reference stands did not change much, while our results have better performance in delineating smaller and more elaborate stands.
3.3 Explained variance
As shown in Table 2, the manual and automatic forest stands explained the similar variance in mean tree height and mean DBH. The explained variances of mean tree height and mean DBH were 96.88% and 97.60% for the forest management inventory stands, 96.77% and 97.61% for the multi-segmented forest stands, 97.35% and 97.86% for our results. As for the mean canopy height, our method explained 81.8% of the variation, compared with 74.49% for the forest management inventory stands and 79.67% for the multi-segmented forest stands. The high explained variance of our results and forest management inventory stands indicates that they both have high internal consistency and good outer differentiation. The number of sample plots within the automatically delineated stands was similar to that in the manually delineated stands, and the explained variance of them was the same, which means that the automatic delineating method produced suitable forest stands.
| Table 2. The explained variance of stand attributes of automatic forest stands and forest management inventory stands. | |||
| Forest stands | Explained variance of mean tree height (%) | Explained variance of mean diameter at breast height (%) | Explained variance of mean canopy height (%) |
| Forest management inventory stands | 96.88 | 97.60 | 74.49 |
| Forest stands by multiresolution segmentation method | 96.77 | 97.61 | 79.67 |
| Forest stands by our method | 97.35 | 97.86 | 81.80 |
4 Discussion
4.1 Optimal parameters
By comparing the boundary maintaining effect between different regions and the smoothing effect within the same region, the MVF filter performed better. After the trials and statistics, the smoothed 5 m spatial resolution CHM was chosen as the optimal data for over-segmentation. In the eCognition developer, the preprocessed CHM was tested with multiple sets of segment scale parameter, shape parameter and compactness parameter, the optimal values were 10, 0.1 and 0.5, respectively. And the optimal values of TP1, SH1, TP2, and SH2 were 0.2, 3, 0.5, and 5, respectively. The method of this study was performed with different thresholds for different forest scales according to different research purposes. In general, the maximum forest stand area was 50 hectares for natural forest and 20 hectares for plantation, and the minimum area was 0.5 hectares. While for the logging stands and DOM-based stands, the maximum area was 5 hectares, the minimum area was 0.1 hectares, and the optimal TP1 value was changed to 0.5.
In this paper, we down-sampled the CHM from 1 m to 5 m spatial resolution, and then used the MVF filter to reduce excessive fragmentation and preserve boundaries effectively, which led to a better delineation of forest stands. These treatments also greatly reduced excessive fragmentation when performing segmentation. At the same time, the parameters we chose from multiple trials performed well. We also tested several methods for over-segmentation, such as multiresolution segmentation method, Orfeo Toolbox (OTB) method (Grizonnet et al. 2017; Stereńczak et al. 2018), and Simple Linear Iterative Cluster (SLIC) method (Kim et al. 2013). The multiresolution method in the eCognition developer had the best performance.
The 5 m CHM smoothed by the MVF filter showed better results than other inputs. The optimal segmentation parameters of scale, shape, and compactness are 10, 0.1, and 0.5, respectively. The final results showed that in the whole forest farm, the boundaries of forest stands which were delineated automatically could reflect the real situation of forest stands more accurately than forest management inventory stands. The automatic method could better reflect the characteristics of different stands. In this study, the attributes obtained from the CHM truly reflect the tree height, canopy closure, stand density and tree species. Therefore, the use of these attributes can delineate the forest stands finely. In contrast, it was difficult to observe the detailed and accurate differences in stand structure when doing visual interpretation for forest stand delineating, so the manually delineated stand boundaries often do not match the actual stand boundaries well.
4.2 Analysis of accuracy verification
Our method delineated stands more accurately than the multiresolution segmentation method in terms of explained variance and IoU for the following reasons: our method takes several stand attributes into account, such as tree height, tree species composition, forest stands area, and length of common edges. In contrast, the multiresolution segmentation method only considered scale, shape, and compactness, which was suitable for conventional image segmentation but not quite relevant for forest stand delineation. In addition, the tree species vector map used in the multiresolution segmentation method was fixed before the segmentation, so it did not quite fit the real forest stands area. In consequence, the forest stands delineated based on this tree species vector map have a certain degree of uncertainty. On the contrary, our method calculated the species composition at each step of the merging process, and the species composition was considered at each step of the cycle. These improved the consistence of delineating results with reality. Moreover, our method was flexible, allowing the area threshold to be changed according to the delineating purpose. For example, the thresholds were changed for logging stands to achieve better-delineating results in our experiments. But if using a multiresolution segmentation method to achieve this purpose, the parameters adjustment involved would be much more cumbersome.
There were three main scenarios for forest stands with low IoU: (1) The boundaries of the manually delineated forest stands did not correspond to the true stand boundaries, while the boundaries of the automatically delineated forest stands did. (2) In some forest management inventory stands, homogeneous areas were manually divided into many stands for the convenience of operation, while the automatic method could not divide them according to homogeneity. (3) The height of the saplings stands was too low, so these stands were not divided by the automatically delineated method. The reason (1) and (2) were that the forest management inventory stands do not correspond to the forest stands in reality, whereas our method performed better in those areas. Our method can reduce the error of subjective factors or image quality problems in manual visual interpretation. Therefore, lower IoU did not mean that the automatic delineation was inappropriate but showed the advantage of being more consistent with the true values and not being influenced by subjective factors, image quality, and other factors. For reason (3), it was also difficult to distinguish young trees from the bare ground by visual interpretation of the manual delineating. These areas need to be identified by field survey in forestry works. The limited ability to differentiate certain young forests in this study can be attributed to additional factors, such as the area and other related aspects that influence the segmentation process prior to the application of the rules. These factors warrant further investigation in future research.
In comparison with previous studies, our method only uses a few significant forest attributes rather than a large number of attributes for delineation (Dechesne et al. 2017). Some delineating results were high in explanatory variance, but many of the delineated stands were smaller than forest management inventory stands (Sanchez-Lopez et al. 2018; Stereńczak et al. 2018; Pascual and Tóth 2022). Our method balanced homogeneity and area to some extent, and the obtained stands were comparable to those of forest management inventory stands. In terms of research application scope, some studies tested delineation methods on relatively small scales, while our method achieved fine delineation at a complete forest farm scale with high internal consistency and accuracy. Additionally, our method is more flexible and can create smaller and more homogeneous segments by adjusting the parameters, which may benefit the prediction of growing stock attributes for forests (Pascual et al. 2019). Moreover, our forest stands are comparable with logging stands and stands based on DOM, which could be further tested for calibration of satellite data (Stereńczak et al. 2018).
5 Conclusions
The utilization of airborne LiDAR and hyperspectral data in our method maximizes the incorporation of stand structure information, including tree height, canopy closure, and tree species details. Its efficiency was much higher than forest management inventory stands delineating. The automatically delineated forest stands were consistent with forest management inventory stands in terms of shape and area, with better internal consistency and larger external variability. The boundaries of automatic forest stands were more consistent with reference forest stands than forest management inventory stands. Following appropriate post-processing, the obtained results prove valuable for forest resource survey and planning, offering time savings, reduced subjectivity, and better accuracy in delineating stand boundaries. Moreover, these results support more precise extraction of forest parameters and enhance the effectiveness of silvicultural treatments, contributing to elevated forest management quality and diminished economic losses.
The study showed that our method was flexible and capable of producing accurate stand delineation results. For the purpose of fine delineation, several criteria were considered, and the criteria can be changed based on different forest conditions. Additionally, incorporating additional information of broad-leaved trees has the potential to further enhance the accuracy of delineation results.
Declaration of openness of research materials, data, and code
The authors do not have permission to share data. The source code is accessible on https://github.com/HaoXplorer/Forest-Stand-Delineation.git.
Authors’ contributions
Conceptualization and Supervision Y.P.; Methodology and experiment H.X.; Writing-original draft, H.X.; Writing-review and editing, H.X., Y.P., W.J. and Y.B.
Funding
This research was funded by National Key Research and Development Program (2023YFD2200804 & 2017YFD0600404).
Declaration
In compliance with ethical standards, we declare the use of supplements in this manuscript.
References
Dalponte M, Bruzzone L, Gianelle D (2012) Tree species classification in the Southern Alps based on the fusion of very high geometrical resolution multispectral/hyperspectral images and LiDAR data. Remote Sens Environ 123: 258–270. https://doi.org/10.1016/j.rse.2012.03.013.
de Lera Garrido A, Gobakken T, Ørka HO, Næsset E, Bollandsås OM (2020) Reuse of field data in ALS-assisted forest inventory. Silva Fenn 54, article id 10272. https://doi.org/10.14214/sf.10272.
Dechesne C, Mallet C, Le Bris A, Gouet-Brunet V (2017) Semantic segmentation of forest stands of pure species combining airborne LiDAR data and very high resolution multispectral imagery. ISPRS J Photogramm Remote Sens 126: 129–145. https://doi.org/10.1016/j.isprsjprs.2017.02.011.
Dian Y, Li Z, Pang Y (2015) Spectral and texture features combined for forest tree species classification with airborne hyperspectral imagery. J Indian Soc Remote Sens 43: 101–107. https://doi.org/10.1007/s12524-014-0392-6.
Diedershagen O, Koch B, Weinacker H (2004) Automatic segmentation and characterisation of forest stand parameters using airborne LiDAR data, multispectral and fogis data. Int Arch Photogramm 36: 208–212.
eCognition Developer T (2011) 8.7 reference book. Trimble Documentation, Trimble Germany GmbH, München, Germany.
Feret J-B, Asner GP (2012) Tree species discrimination in tropical forests using airborne imaging spectroscopy. IEEE Trans Geosci Remote Sens 51: 73–84. https://doi.org/10.1109/TGRS.2012.2199323.
Grizonnet M, Michel J, Poughon V, Inglada J, Savinaud M, Cresson R (2017) Orfeo ToolBox: open source processing of remote sensing images. Open Geospatial Data Softw Stand 2: 1–8. https://doi.org/10.1186/s40965-017-0031-6.
Haara A, Haarala M (2002) Tree species classification using semi-automatic delineation of trees on aerial images. Scand J For Res 17: 556–565. https://doi.org/10.1080/02827580260417215.
Hernando A, Tiede D, Albrecht F, Lang S (2012) Spatial and thematic assessment of object-based forest stand delineation using an OFA-matrix. Int J Appl Earth Obs Geoinformation 19: 214–225. https://doi.org/10.1016/j.jag.2012.05.007.
Jia W, Pang Y (2023) Tree species classification in an extensive forest area using airborne hyperspectral data under varying light conditions. J For Res 34: 1359–1377. https://doi.org/10.1007/s11676-022-01593-z.
Jia W, Sun Y, Pukkala T, Jin X (2019) Improved cellular automaton for stand delineation. Forests 11, article id 37. https://doi.org/10.3390/f11010037.
Jia W, Pang Y, Tortini R (2024) The influence of BRDF effects and representativeness of training data on tree species classification using multi-flightline airborne hyperspectral imagery. ISPRS J Photogramm Remote Sens 207: 245–263. https://doi.org/10.1016/j.isprsjprs.2023.11.025.
Kangas A, Maltamo M (eds) (2006) Forest inventory: methodology and applications. Managing Forest Ecosystems 10, Springer. https://doi.org/10.1007/1-4020-4381-3.
Kim K-S, Zhang D, Kang M-C, Ko S-J (2013) Improved simple linear iterative clustering superpixels. Proceedings of the IEEE International Symposium on Consumer Electronics (ISCE), Hsinchu, Taiwan, pp 259–260. https://doi.org/10.1109/ISCE.2013.6570216.
Koch B, Straub C, Dees M, Wang Y, Weinacker H (2009) Airborne laser data for stand delineation and information extraction. Int J Remote Sens 30: 935–963. https://doi.org/10.1080/01431160802395284.
Koivuniemi J, Korhonen KT (2006) Inventory by compartments. In: Kangas A, Maltamo M (eds) Forest inventory: methodology and applications. Managing Forest Ecosystems 10, Springer, pp 271–278. https://doi.org/10.1007/1-4020-4381-3.
Leckie DG, Gougeon FA, Walsworth N, Paradine D (2003) Stand delineation and composition estimation using semi-automated individual tree crown analysis. Remote Sens Environ 85: 355–369. https://doi.org/10.1016/S0034-4257(03)00013-0.
Leppänen V, Tokola T, Maltamo M, Mehtätalo L, Pusa T, Mustonen J (2008) Automatic delineation of forest stands from LiDAR data. Int Arch Photogramm 38: 5–8.
Luo J, Wu T, Wu Z (2020) Methods of intelligent computation and pattern mining based on Geo-parcels. J Geo-Inf Sci 22: 57–75. https://doi.org/10.12082/dqxxkx.2020.190462.
Mora B, Wulder MA, White JC (2010) Segment-constrained regression tree estimation of forest stand height from very high spatial resolution panchromatic imagery over a boreal environment. Remote Sens Environ 114: 2474–2484. https://doi.org/10.1016/j.rse.2010.05.022.
Mustonen J, Packalen P, Kangas A (2008) Automatic segmentation of forest stands using a canopy height model and aerial photography. Scand J For Res 23: 534–545. https://doi.org/10.1080/02827580802552446.
Nowozin S (2014) Optimal decisions from probabilistic models: the intersection-over-union case. Proceedings of the IEEE Conference on Computer Vision and Pattern Recognition, Columbus, OH, USA, pp 548–555. https://doi.org/10.1109/CVPR.2014.77.
Pang Y, Li Z, Ju H, Lu H, Jia W, Si L, Guo Y, Liu Q, Li S, Liu L, Xie B, Tan B, Dian Y (2016) LiCHy: The CAF’s LiDAR, CCD and Hyperspectral Integrated Airborne Observation System. Remote Sens 8, article id 398. https://doi.org/10.3390/rs8050398.
Pascual A, Tóth SF (2022) Using mixed integer programming and airborne laser scanning to generate forest management units. J For Res 33: 217–226. https://doi.org/10.1007/s11676-021-01348-2.
Pascual A, Pukkala T, de Miguel S, Pesonen A, Packalen P (2019) Influence of size and shape of forest inventory units on the layout of harvest blocks in numerical forest planning. Eur J For Res 138: 111–123. https://doi.org/10.1007/s10342-018-1157-5.
Pukkala T (2019a) Optimized cellular automaton for stand delineation. J For Res 30: 107–119. https://doi.org/10.1007/s11676-018-0803-6.
Pukkala T (2019b) Using ALS raster data in forest planning. J For Res 30: 1581–1593. https://doi.org/10.1007/s11676-019-00937-6.
Pukkala T (2020) Delineating forest stands from grid data. For Ecosyst 7, article id 13. https://doi.org/10.1186/s40663-020-00221-8.
Pukkala T (2021) Can Kohonen networks delineate forest stands? Scand J For Res 36: 198–209. https://doi.org/10.1080/02827581.2021.1897668.
Sanchez-Lopez N, Boschetti L, Hudak AT (2018) Semi-automated delineation of stands in an even-age dominated forest: a LiDAR-GEOBIA two-Stage evaluation strategy. Remote Sens 10, article id 1622. https://doi.org/10.3390/rs10101622.
Stereńczak K, Lisańczuk M, Erfanifard Y (2018) Delineation of homogeneous forest patches using combination of field measurements and LiDAR point clouds as a reliable reference for evaluation of low resolution global satellite data. For Ecosyst 5, article id 1. https://doi.org/10.1186/s40663-017-0128-5.
Sun Y, Wang W, Pukkala T, Jin X (2021) Stand delineation based on laser scanning data and simulated annealing. Eur J For Res 140: 1065–1080. https://doi.org/10.1007/s10342-021-01384-x.
Terrasolid (2023) https://terrasolid.com/products/terrascan/. Accessed 14 July 2023.
Tokola T, Vauhkonen J, Leppänen V, Pusa T, Mehtätalo L, Pitkänen J (2008) Applied 3D texture features in ALS-based tree species segmentation. Proceedings of the International Archives of Photogrammetry, Remote Sensing and Spatial Information, GEOBIA 2008, Calgary, AB, Canada, 5–8 August 2008.
Wu Z, Heikkinen V, Hauta-Kasari M, Parkkinen J, Tokola T (2013) Forest stand delineation using a hybrid segmentation approach based on airborne laser scanning data. In: Kämäräinen JK, Koskela M (eds) Image Analysis. SCIA 2013. Lecture Notes in Computer Science 7944, Springer, Berlin, Heidelberg, pp 95–106. https://doi.org/10.1007/978-3-642-38886-6_10.
Wu Z, Heikkinen V, Hauta-Kasari M, Parkkinen J, Tokola T (2014) ALS data based forest stand delineation with a coarse-to-fine segmentation approach. Proceedings of the 7th International Congress on Image and Signal Processing, Dalian, China, pp 547–552. https://doi.org/10.1109/CISP.2014.7003840.
Wulder MA, White JC, Hay GJ, Castilla G (2008) Towards automated segmentation of forest inventory polygons on high spatial resolution satellite imagery. For Chron 84: 221–230. https://doi.org/10.5558/tfc84221-2.
Total of 38 references.
