Lennart Noordermeer  ,
Erik Næsset,
Terje Gobakken
,
Erik Næsset,
Terje Gobakken
Effects of harvester positioning errors on merchantable timber volume predicted and estimated from airborne laser scanner data in mature Norway spruce forests
Noordermeer L., Næsset E., Gobakken T. (2022). Effects of harvester positioning errors on merchantable timber volume predicted and estimated from airborne laser scanner data in mature Norway spruce forests. Silva Fennica vol. 56 no. 1 article id 10608. https://doi.org/10.14214/sf.10608
Highlights
- Timber volume was estimated using harvester and airborne laser scanner (ALS) data acquired with different scanners over eight years
- The year of ALS acquisition did not have a significant effect on errors in timber volume estimates
- Accuracies of timber volume estimates decreased significantly with increasing levels of positioning error
- When using inaccurately positioned harvester data, larger grid cells are beneficial.
Abstract
Newly developed positioning systems in cut-to-length harvesters enable georeferencing of individual trees with submeter accuracy. Together with detailed tree measurements recorded during processing of the tree, georeferenced harvester data are emerging as a valuable tool for forest inventory. Previous studies have shown that harvester data can be linked to airborne laser scanner (ALS) data to estimate a range of forest attributes. However, there is little empirical evidence of the benefits of improved positioning accuracy of harvester data. The two objectives of this study were to (1) assess the accuracy of timber volume estimation using harvester data and ALS data acquired with different scanners over multiple years and (2) assess how harvester positioning errors affect merchantable timber volume predicted and estimated from ALS data. We used harvester data from 33 commercial logging operations, comprising 93 731 harvested stems georeferenced with sub-meter accuracy, as plot-level training data in an enhanced area-based inventory approach. By randomly altering the tree positions in Monte Carlo simulations, we assessed how prediction and estimation errors were influenced by different combinations of simulated positioning errors and grid cell sizes. We simulated positioning errors of 1, 2, …, 15 m and used grid cells of 100, 200, 300 and 400 m2. Values of root mean square errors obtained for cell-level predictions of timber volume differed significantly for the different grid cell sizes. The use of larger grid cells resulted in a greater accuracy of timber volume predictions, which were also less affected by positioning errors. Accuracies of timber volume estimates at logging operation level decreased significantly with increasing levels of positioning error. The results highlight the benefit of accurate positioning of harvester data in forest inventory applications. Further, the results indicate that when estimating timber volume from ALS data and inaccurately positioned harvester data, larger grid cells are beneficial.
Keywords
forest inventory;
ALS;
forest harvester;
GNSS;
precision forestry
-
Noordermeer,
Faculty of Environmental Sciences and Natural Resource Management, Norwegian University of Life Sciences, NMBU, P.O. Box 5003, NO-1432 Ås, Norway
E-mail
lennart.noordermeer@nmbu.no
- Næsset, Faculty of Environmental Sciences and Natural Resource Management, Norwegian University of Life Sciences, NMBU, P.O. Box 5003, NO-1432 Ås, Norway E-mail erik.naesset@nmbu.no
- Gobakken, Faculty of Environmental Sciences and Natural Resource Management, Norwegian University of Life Sciences, NMBU, P.O. Box 5003, NO-1432 Ås, Norway E-mail terje.gobakken@nmbu.no
Received 7 July 2021 Accepted 11 January 2022 Published 14 January 2022
Views 59089
Available at https://doi.org/10.14214/sf.10608 | Download PDF

1 Introduction
Accurate information on the state of forests is crucial for sustainable forest management. To provide such information, forest inventories are implemented at various spatial scales fulfilling different planning needs (Kangas and Maltamo 2006). Large-scale forest inventories provide information relevant in formulating management objectives and policies, typically at national or regional level. Local inventories, on the other hand, are aimed at tactical and strategic planning of forest properties and stands, such as the selection of stands for harvesting. These decisions require information with greater spatial resolution, such as the quantification of timber volume in given stands, in a timely and spatially explicit manner.
Remote sensing has played a key role in forest inventories over the last decades (White et al. 2016). In particular, the use of airborne laser scanning (ALS) has been fundamental due to its ability to characterize three-dimensional (3D) forest structure (Coops et al. 2021). Two main approaches are used to estimate forest attributes from ALS data. The area-based approach (Næsset 2002) is most widely used, by which ALS metrics are calculated for forest inventory sample plots and linked to the plots’ forest attributes in statistical models. The models can then be used to predict those forest attributes for forest areas outside the training dataset, to provide stand-wise estimates based on wall-to-wall predictions of, for example, timber volume or canopy height. Alternatively, the individual tree crown approach (Brandtberg 1999; Hyyppä 1999) can be used, by which individual trees are delineated from the ALS data, ALS metrics are calculated for the obtained tree segments, and then linked to attributes of field reference trees. Whichever method is used, accurately georeferenced field data are essential in ALS-assisted inventories, and constitute a main cost component in operational forest inventories (Gobakken and Næsset 2008).
In the context of reducing inventory costs, data recorded by cut-to-length harvesters have emerged as a promising alternative to conventional field plot measurements in operational forest inventories (Kemmerer and Labelle 2020). In Scandinavia as well as other parts of the world, cut-to-length harvesting accounts for the vast majority of roundwood removals, by which a harvester fells and processes logs in the forest. The operator bucks tree stems into logs according to the dimensions, defects and timber qualities, and assigns assortments to logs on the fly meeting real-time market demands. During harvesting, large amounts of data are automatically collected and stored on the on-board computer, including stem diameters at 10 cm intervals along the stem, log lengths and volumes, species and assortments. Performing many of the same tree measurements commonly obtained from manually measured sample plots, cut-to-length harvesters can record more accurate measurements when calibrated accordingly (Murphy et al. 2006), doing so at a tremendous pace and with far greater detail. In addition, most cut-to-length harvesters are equipped with a Global Navigation Satellite System (GNSS) receiver which provides a spatial reference and time stamps for each harvested tree (Olivera 2016). When linked to the detailed tree measurements recorded during the processing of the tree, such georeferenced harvester measurements provide a wealth of data for forest inventory (Lindroos et al. 2015).
Standardized sensor hardware in cut-to-length harvesters of several manufacturers allows for measuring and recording coordinates of harvested stems automatically (Westerberg 2014; Bhuiyan et al. 2016; La Hera and Morales 2019). When equipped with a differential GNSS receiver, such sensor hardware enables georeferencing of individual stems with submeter accuracy (Hauglin et al. 2017; Noordermeer et al. 2021). Increasing digitalization in the forestry sector (Müller et al. 2019) and ongoing efforts to centralize the flow of harvester data in online databases (Berg et al. 2019) may greatly facilitate the use of accurately positioned harvester data for inventory purposes in the near future.
Previous studies have shown that harvester data, georeferenced with sub-meter accuracy, can be linked to ALS data to provide accurate estimates of timber volume (Hauglin et al. 2018; Maltamo et al. 2019). In other studies, Saukkola et al. (2019) and Söderberg et al. (2021) used harvester data georeferenced with standardized machine sensor equipment and ALS data to estimate various forest attributes. The mentioned studies used ALS datasets acquired as part of a single campaign and with relatively constant acquisition parameters, resulting in homogeneous ALS datasets with regard to point densities and footprint diameters. Furthermore, although the positioning accuracy of harvested stems used as training data has been identified as a fundamental challenge (Lindroos et al. 2015; Söderberg 2015), evidence of positioning accuracy requirements is missing.
We defined two objectives. The first was to assess the accuracy of timber volume estimation using harvester data and ALS data acquired with different scanners and over multiple years. The second was to assess how harvester positioning errors affect merchantable timber volume predicted and estimated from ALS data. By using different cell sizes as training and testing data, we performed simulations to assess how prediction and estimation errors were influenced by different combinations of positioning errors and cell sizes.
2 Material and methods
2.1 Harvester data
Harvester data were collected from 33 logging operations in southern Norway (Fig. 1) between March 2019 and June 2021 using a single-grip Komatsu 931XC harvester equipped with a 230H crane and a C144 harvester head. A total of 93731 tree stems were recorded of which 88% were Norway spruce (Picea abies (L.) H. Karst.), 8% were Scots pine (Pinus sylvestris L.) and 4% were deciduous, mainly birch (Betula pubescens Ehrh.). Harvester production report (HPR) files were exported after each operation in the StanFord 2010 format (Arlinger et al. 2012). The HPR files contained data on tree species, log volumes over bark and time stamps of fellings. We replaced the harvester’s standard GNSS with a Septentrio AsteRx-U real-time kinematic GNSS, comprising two antennas of which positions and rotations were logged at a one second rate in the National Marine Electronics Association (NMEA) format. We computed locations of harvested stems as crane tip coordinates using positions and rotations obtained from the GNSS, as described in detail in Noordermeer et al. (2021). In the mentioned study, a comparison of 285 tree positions recorded by the harvester with control measurements taken on the ground with a real time kinematic GNSS revealed a mean horizontal positioning error of 0.8 m with a standard deviation of 0.4 m. In the current study, we assumed tree positions recorded by the harvester to be free of error, i.e., the positions recorded by the harvester were considered as the reference in the simulations. For each harvested stem, we summed volumes of logs and linked the total log volumes to the corresponding crane tip coordinates.
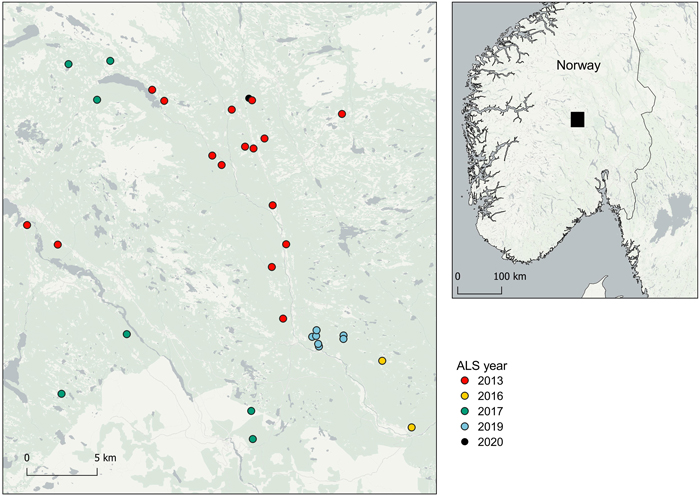
Fig. 1. Overview map of the logging sites from which harvester data were collected, and corresponding airborne laser scanning datasets with year of acquisition (ALS year).
2.2 ALS data
ALS data were acquired in 2013, 2016, 2017, 2019 and 2020 with different instruments and acquisition parameters (Table 1). The ALS surveys covered different areas which in some cases overlapped. Because of this, the elapsed time between ALS and harvester data acquisition varied from one to eight years. Post-processing of the ALS data was carried out by the contractors, Blom Geomatics AS and Terratec AS, Norway, by which laser echoes were classified as ground or non-ground. For each logging site, we retained the most recently acquired ALS data from within the spatial extent of the site. We constructed digital terrain models for the sites as triangulated irregular networks from the laser echoes classified as ground. We then normalized the ALS data by computing the height relative to the terrain height for echoes classified as non-ground.
| Table 1. Airborne laser scanning acquisition parameters, footprint diameters and pulse densities. | ||||||||
| Year | Instrument | Time period | Pulse rate (kHz) | Scan rate (Hz) | Flying altitude (m) | Scanning angle (±°) | Footprint diameter (m) | Pulse density (m–2) |
| 2013 | TopEye S/N 444 | May–July | 200 | 92 | 1500 | 20 | 0.28 | 7.7 |
| 2016 | Riegl LMS Q-1560 | September | 400 | 100 | 2900 | 20 | 0.25 | 3.2 |
| 2017 | Riegl VQ-1560 I | July | 700 | 240 | 2300 | 20 | 0.58 | 6.8 |
| 2019 | Leica ALS70-HP | August | 495 | 69 | 1150 | 16 | 0.73 | 5.9 |
| 2020 | Riegl VQ-1560 II | June | 749 | 158 | 1100 | 29 | 0.75 | 10.4 |
2.3 Enhanced area-based approach
We predicted and estimated merchantable timber volume by adopting the enhanced area-based inventory approach proposed by Packalen et al. (2015), in which edge effects due to tree crowns overlapping boundaries of sample plots and grid cells, hereafter referred to as cells, are accounted for. In this approach, boundaries of plots and cells are adjusted for tree crowns segmented from the ALS data, by which crown segments of “in” trees are merged with the cell, and crown segments of “out” trees are discarded from the cell (Fig. 2). In contrast to the mentioned study, however, we labelled trees as “in” or “out” based on the proportion of segmented crown area overlapping the cell, as opposed to local maxima obtained from canopy height models derived from the ALS data falling in- or outside the cell area boundary, see further details below.
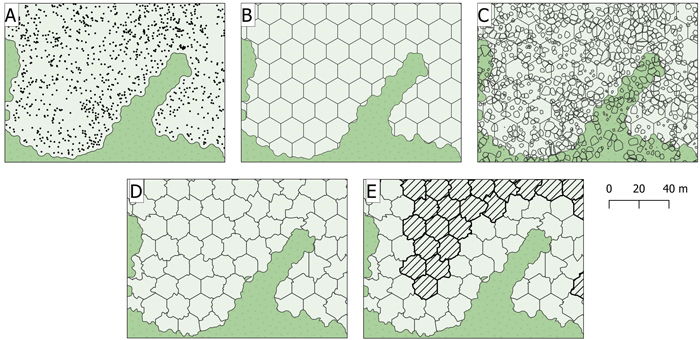
Fig. 2. The enhanced area-based inventory approach used in this study. (A) buffer around positions of harvested stems, (B) hexagonal grid, (C) overlay with polygons of tree crowns segmented from the ALS data, (D) cell borders adjusted for segmented trees and sliver cells and (E) cells within a –15 m buffer used in Monte Carlo simulations marked with dashed lines.
For each logging site, we generated a unary union of buffers around the positions of harvested stems (Fig. 2A). We tessellated the polygons into hexagonal grids of 100, 200, 300 and 400 m2 cells. We then segmented individual trees from the ALS data using the itcSegment package in R (Dalponte 2016). Using the obtained polygons of crown segments, we adjusted polygons of cell boundaries (Fig. 2D). We merged sliver polygons (< 80 m2) with the neighbouring cell with which the sliver polygons shared the largest proportion of boundary. We split large cells (> 1.5 times the grid cell size used) into two cells of equal size, to limit the variation in cell size. The resulting number of cells used in the analysis ranged from 3038 to 10 595 for the four cell sizes (Table 2).
| Table 2. Number of cells (n), selected predictors, model fit statistics for different cell sizes and accuracies of timber volume estimates for logging operations. | ||||||||
| Cell size (m2) | n | Predictors | Pseudo R2 | RMSE%w | ME%w | Min error (m3 ha–1) | Max error (m3 ha–1) | Mean error (m3 ha–1) |
| 100 | 10595 | Hmax + Hmean + D1 | 0.52 | 14.93 | –0.06 | –87.6 | 58.9 | 0.3 |
| 200 | 5707 | Hmean + D0 | 0.59 | 14.07 | –0.04 | –83.4 | 67.9 | 3.4 |
| 300 | 3929 | Hmean + D0 | 0.63 | 14.30 | –0.27 | –88.7 | 64.5 | 2.3 |
| 400 | 3038 | H80 + D0 | 0.63 | 12.71 | –0.32 | –74.7 | 56.9 | 3.1 |
2.4 Computation of harvester plot values
We extracted the georeferenced harvester stem data from within cells to calculate cell-level merchantable timber volumes, hereafter referred to as timber volumes. The timber volumes were calculated as the sum of log volumes of all assortments (over bark) recorded by the harvester within a given cell, scaled to per hectare values. For the computation of ALS metrics, we used all laser echoes that fell within the spatial extent of the adjusted cells, i.e., first of many, single, intermediate and last of many echoes. We computed canopy height metrics from echoes with a height > 2 m above the ground. The canopy height metrics included the heights at the 10th, 20th, …, 90th percentiles of echo height distributions (H10, H20, …, H90), and the mean and maximum height (Hmean, Hmax, respectively). We then computed canopy density metrics (D0, D1,..., D9) by dividing the height range between 2 m and the 95th percentile into 10 fractions of equal height, and computed the proportion of echoes between the lower limit of each fraction and the 95th percentile to the total number of echoes. Finally, we computed the number of echoes > 2 m above the ground (N).
2.5 Model selection and fitting
The analysis was divided into two parts to address objectives one and two, respectively. The first part entailed the estimation of timber volume at logging operation level, without simulating positioning errors. The second part entailed the simulation of positioning errors to assess how they affect prediction and estimation errors across different cell sizes.
When plotting values of timber volume computed for cells against the corresponding ALS metrics during a preliminary analysis, we found that the relationships were, in many cases, not linear. We therefore fitted nonlinear regression models, formulated as:
![]()
where V is timber volume (m3 ha–1) used as the response variable, β0, β1,..., β22 are model parameters to be estimated, X0, X1,..., X22 are ALS metrics used as candidate predictors and ε is the error term.
For the model selection, we first log-transformed the response and all candidate predictor variables, and selected subsets of predictors using the leaps package in R (Lumley 2004). We selected subsets with the smallest values of Bayesian information criterion, and fitted candidate multiple linear regression models. We penalized candidate models for collinearity according to the variance inflation factor (VIF). If a model included a predictor with a VIF > 5, we selected a model with fewer predictors. We then estimated the parameter estimates of the nonlinear model using the stats package in R, using the parameter estimates of the linear model, transformed to arithmetic scale, as starting values. To assess the fit of the models, we computed the pseudo R2 as the square of the correlation between a model’s observed and predicted values (Efron 1978).
2.6 Timber volume estimation without simulated positioning error
In the first part of the analysis, we estimated the mean timber volume for the 33 logging operations in a leave-one-operation-out fashion. The leave-one-operation-out cross validation resembled a situation in which data from previous logging operations are available, and an estimate for a new logging operation is desired. We omitted logging operations from the dataset, one at a time, and fitted the model with data from the remaining operations. We used the model to predict timber volume for cells of the logging operation omitted from the model training dataset, and repeated the procedure until we obtained predictions for all cells. We then estimated the mean timber volume for each operation as the mean of volume predictions and compared the estimate to the timber volume recorded by the harvester.
| Table 3. Logging operation level statistics for harvester data obtained from the 33 operations. | ||||
| Min | Mean | Max | Std.dev | |
| Mean timber volume (m3 ha–1) | 115 | 248 | 419 | 84 |
| Mean diameter at breast height (mm) | 157 | 209 | 277 | 29 |
| Number of stems | 4442 | 149 629 | 518 012 | 125 542 |
| Harvested area (ha) | 0.14 | 3.03 | 10.21 | 2.64 |
The logging operations varied considerably in size (Table 3). To evaluate the accuracy of the resulting timber volume estimates, we therefore computed the root mean square error (RMSE) between observed and estimated timber volume, weighted by the size of the harvested area and relative to the mean value obtained from the harvester measurements:

where RMSE%w is the weighted RMSE relative to the observed mean, n is the number of logging operations, Volumei is the observed timber volume of the out-of-sample logging operation i and ![]() is the corresponding estimated value, Area is the size of the logging operation in hectares and
is the corresponding estimated value, Area is the size of the logging operation in hectares and ![]() is the mean timber volume for all logging operations.
is the mean timber volume for all logging operations.
We further estimated the mean error, i.e., the mean difference between observed and estimated timber volume, weighted by the size of the harvested area and relative to the mean value obtained from the harvester measurements:

Finally, we tested whether the year of ALS data acquisition had a statistically significant effect on errors in estimated timber volume using analysis of variance (ANOVA) tests.
2.7 Effects of positioning errors on timber volume predictions and estimates
In the second part of the analysis, we assessed the effects of harvester positioning errors on timber volume predictions and estimates. We introduced horizontal shifts in tree positions recorded by the harvester prior to computing the reference harvester plot data. We randomly applied fixed horizontal shifts of 1, 2, …, 15 m in Monte Carlo simulations (Mooney 1997). For each level of positioning error, tree positions in the training dataset were shifted horizontally in a random direction and a new harvester training dataset was computed using the altered tree positions within each cell and the enhanced area-based approach detailed in section 2.3. To avoid systematic edge effects along borders of harvested stands, i.e., that trees potentially were moved out of the study area due to the altered positions but never into the study area from outside the harvested areas, we only considered core areas of the harvested areas. We defined those core areas as cells within a 15 m buffer of the harvested areas (Fig. 2E), corresponding to the maximum simulated positioning error.
The plot data computed from the harvested stems and their simulated positions were used for model training and prediction in a leave-one-operation-out fashion. For consistency, and to avoid effects related to model selection in the comparison of different cell sizes, we used a single model with the same predictor variables for all cell sizes. For each level of positioning error and Monte Carlo iteration, we fitted the model with the erroneous tree position data, repeating the procedure until the accumulated mean values of RMSE% had stabilized. To evaluate the cell-level prediction accuracy, we computed the RMSE between observed and predicted values relative to the mean value obtained from the harvester measurements:

In addition to the abovementioned analyses, we assessed the effects of harvester positioning errors on timber volume estimates at logging operation level. For this, we used the predictions generated using the erroneously positioned harvester data for the core areas shown in Fig. 2E. We only considered core areas with a minimum area of 0.2 hectare in the analysis, conforming to the typical minimum size of forest stands in commercial Norwegian forest planning. We then estimated the mean timber volume per hectare as the mean of predictions and compared the estimates to corresponding reference values estimated from the stem data without positioning errors. For both the predictions at cell level and the estimates at logging operation level, we tested whether the magnitude of positioning error had a statistically significant effect on values of RMSE% and RMSE%w. Lastly, we assessed whether mean values of RMSE% and RMSE%w differed significantly across groups of positioning errors and cell sizes. For this, we carried out a post-hoc analysis using estimated marginal means, i.e., least-squares means to perform pairwise comparisons between groups with the ‘emmeans’ package in R.
3 Results
3.1 Timber volume estimation without simulated positioning error
The first part of the analysis comprised the estimation of timber volume from ALS data, without simulated positioning errors. The results are shown in Table 2 and Fig. 3. We obtained the smallest value of RMSE%w by using cells of 400 m2. Although data from five different ALS acquisitions were used, and the elapsed time between ALS acquisition and harvesting ranged considerably (from one to eight years), errors in timber volume estimates did not differ significantly between ALS acquisitions for any of the cell sizes (p < 0.05).
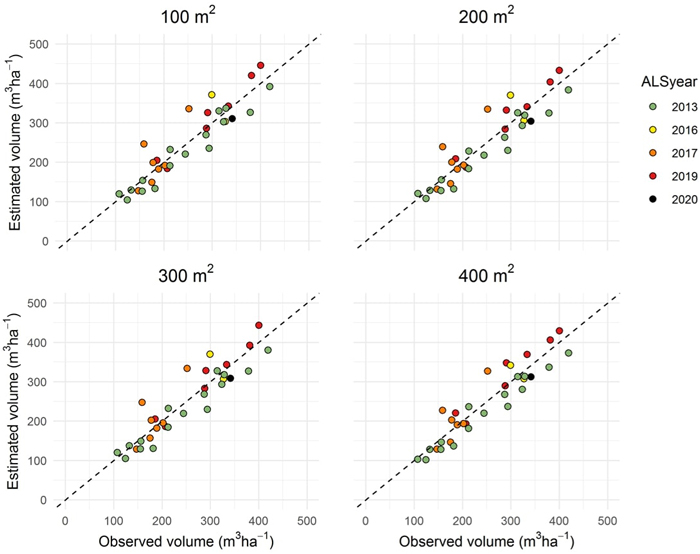
Fig. 3. Observed timber volume plotted against timber volume estimated from airborne laser scanner (ALS) data acquired from 2013 to 2020 (ALSyear) for the 33 logging operations and four cell sizes.
3.2 Effects of positioning errors on timber volume predictions and estimates
Fig. 4 shows the effects of the simulated levels of positioning error on values of RMSE% obtained for timber volume predictions at cell level. As predictor variables, we manually selected Hmean, D1 and N, as we found those to result in good and similar model fit statistics for all cell sizes. 6000 trials were sufficient for the accumulated mean values of RMSE% to stabilize, i.e., the proportional change in the respective values of the last 100 trials were < 0.05 for all cell sizes and levels of positioning error. ANOVA tests revealed that the magnitude of positioning error had statistically significant effects on values of RMSE% obtained for the volume estimates (p < 0.05). Values of RMSE% decreased as cell sizes increased. Pairwise comparisons of values of RMSE% revealed that for the four cell sizes, all mean values of RMSE%w obtained for the 15 positioning errors differed significantly (p < 0.05).
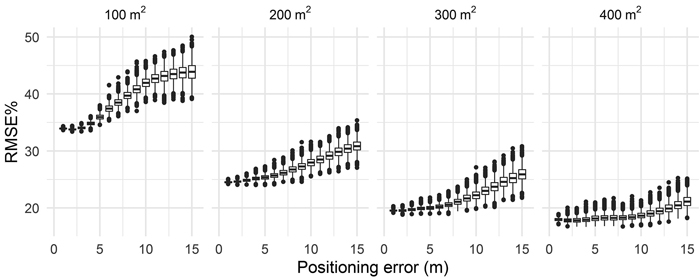
Fig. 4. Mean values of RMSE% of cell level timber volume predictions obtained for the four cell sizes and simulated positioning errors of harvested stems.
We further assessed the effects of harvester positioning errors on timber volume estimates at logging operation level. Fig. 5 shows values of RMSE%w obtained for the levels of simulated positioning errors. When only several, say, up to 5 m of positioning errors were introduced, values of RMSE%w were considerably smaller than corresponding values obtained in the estimation of timber volume without simulated positioning errors (section 3.1). The magnitude of positioning error had a statistically significant effects on values of RMSE%w obtained for the volume estimates (p < 0.05) for all cell sizes. All pairwise means of values of RMSE%w obtained for the four cell sizes and 15 positioning errors differed significantly (p < 0.05).
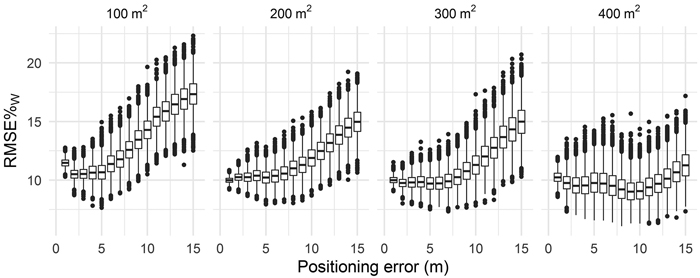
Fig. 5. Mean values of RMSE%w of timber volume estimates at logging operation level obtained for the four cell sizes and simulated positioning errors of harvested stems.
4 Discussion
In this study, we used harvester data and five ALS datasets acquired over a period of eight years to estimate timber volume in commercial logging operations. We generated plot-level inventory data from harvested stems georeferenced with submeter accuracy and ALS data, and used the data to estimate timber volume in an enhanced area-based inventory approach. By randomly altering the tree positions in Monte Carlo simulations, we quantified the effects of harvester positioning errors on timber volumes estimated from ALS data.
Currently, harvester data do not suffice in providing all the reference data needed for a complete forest management inventory covering all forest types and ages. This is because applicable data typically only comprise mature forests ready for final felling, as previously recognized by Hauglin et al. (2018) and Saukkola et al. (2019). The use of harvester data thus entails the risk that the data used for model calibration do not fully cover the variation of forest attributes in the inventory area. However, harvester data can potentially supplement conventional sample plot data collected in inventories. In addition, the data may prove beneficial to a range of forest inventory applications that fall outside the scope of periodic forest management inventories, such as short-term planning of timber harvesting within a region in which a harvester operates. For example, harvester data may prove useful in providing volume estimates within a short time frame in tactical planning, for the selection of stands for harvesting in the near future.
4.1 Timber volume estimation without simulated positioning errors
Our results point to the potential of using accurately positioned harvester data and ALS data for estimating timber volume in mature forests. This potential has been demonstrated in earlier studies, for example by Hauglin et al. (2018) who used harvester and ALS data to predict timber volume at plot level, and compared four modelling approaches. Compared to the values of RMSE% ranging from 19% to 56% in the mentioned study, we obtained greater accuracies for the logging operation level estimates in this study, partly because our estimates represented entire logging operations as opposed to smaller cells. The obtained accuracies of timber volume estimates were also greater than those obtained by Saukkola et al. (2019), who presented values of RMSE% in the range of 25.9–32.2 at stand level. Our results were however in line with results obtained by Maltamo et al. (2019) and Söderberg et al. (2021). They used harvester data and ALS data to estimate, among other variables, timber volume, and obtained values of RMSE% of 8.4–11.9 and 11.0–14.2, respectively. Our slightly smaller accuracies (RMSE%w of 12.7–14.4) may partly be explained by the fact that we used five different ALS datasets, and the elapsed time between ALS and harvester data ranging from one to eight years.
We used data from five ALS acquisitions carried out in different years, with different instruments, acquisition parameters and pulse densities. Additionally, and as stated above, the elapsed time between ALS acquisition and harvesting varied considerably from one to eight years. Nevertheless, the ANOVA test showed that the year of ALS acquisition did not have statistically significant effects on errors in volume estimates. Indeed, previous studies have shown that pooled data from multiple ALS acquisitions can effectively be used to predict forest attributes (Næsset et al. 2005; Kotivuori et al. 2016; Noordermeer et al. 2019). In the current study, different time lags between ALS and harvester data acquisitions did not cause any major problems in the estimation, even if the elapsed time between data acquisitions was as great as eight years in the most extreme cases. However, our data only included mature Norway spruce forest, and more research is needed to investigate how different time lags may affect the estimation in other forest types. A time period of eight years does, however, not surpass what has been considered to be the shelf life of ALS data in forest inventory applications (McRoberts et al. 2018). As such, the accuracy of the obtained timber volume estimates indicates that even when different ALS datasets are used and there are different and substantial time lags between harvester and ALS data acquisition, acceptable levels of accuracy can be obtained.
4.2 Effects of harvester positioning errors on predicted and estimated timber volumes
As expected, the Monte Carlo simulations showed that accuracies of cell-level timber volume predictions decreased with increasing levels of positioning error. The ANOVA tests revealed that the simulated positioning errors had statistically significant effects on values of RMSE%. This result highlights the importance of accurate positioning in harvester data when using the data in ALS-based forest inventory. In addition, we found that prediction errors for cells decreased as cell sizes increase. This result confirms findings presented by Rasinmäki and Melkas (2005) and Gobakken and Næsset (2009), of larger cells being more robust to positioning errors than smaller cells. This result may be expected, as the larger cells reduce the probability of a tree ending up within the spatial extent of a wrong cell. As a result, when a cell size of 400 m2 was used, mean values of RMSE% increased only marginally from 18.0 to 21.2 for positioning errors of 1 and 15 m, respectively.
In comparing the timber volume estimates based on ALS data to the observed values, we assumed tree positions recorded by the harvester to be free of error. However, tree positions measured with the positioning system used in this study can be expected to deviate from their actual positions by 0.8 m (Noordermeer et al. 2021). This error is largely due to the harvesters’ telescopic boom extension not being accounted for in the current positioning system. However, an error on the order of 0.8 m is smaller than all positioning errors simulated in the current study. It is therefore unlikely that the errors would change the main findings of this study regarding the effects of positioning errors on timber volume estimated from ALS data. Such a positioning error may also be considered small in comparison to positioning errors obtained using cut-to-length harvesters without differential GNSS positioning and without sensor-equipped crane solutions (20 m; Lindroos et al. 2015).
We used cells with sizes of approximately 100, 200, 300 and 400 m2 in the enhanced area based approach. Sample plot size has been found to influence the accuracy of forest attributes estimated from field plot and ALS data in other studies, where greater plot-level accuracies have been obtained when larger plots were used (Mauya et al. 2015; Næsset et al. 2015). Using harvester and ALS data to estimate timber volume, Maltamo et al. (2019) obtained a slightly better accuracy when smaller plot sizes were used. Saukkola et al. (2019) used harvester and ALS data to estimate multiple forest attributes, and obtained the same result when estimating timber volume when the position of the harvester head was used. In this study, we obtained greater accuracies for larger cells, for which the effects of positioning errors were also smallest. Larger plots may be expected to reduce the effects of positioning errors, not only because co-location errors are less likely to occur when using larger cell sizes, but also because edge effects are reduced. As positioning accuracy of harvester data becomes greater, the use of smaller prediction units and perhaps individual tree segments may be possible. Based on our results, however, larger cells should be recommended when using harvester data with a known positioning error of several meters or more.
5 Conclusions
Four main conclusions can be drawn for this study. First, harvester data can be linked to ALS data acquired over multiple years and with different scanners to estimate timber volume, without the year of ALS acquisition having a significant effect on errors in timber volume estimates. Second, greater accuracy of timber volume estimates may be expected when larger cells are used. Third, accuracies of timber volume predictions decrease significantly with increasing levels of positioning error. Finally, our results highlight the benefit of accurate positioning of harvester data in forest inventory applications, and indicate that when estimating timber volume from inaccurately positioned harvester data and ALS data, larger cells should be preferred.
Authors’ contributions
Conceptualization, L.N., E.N, T.G.; methodology, L.N, E.N, T.G.; data acquisition, L.N, T.G.; analysis, L.N; interpretation of data and results, L.N; scientific writing, L.N, E.N, T.G.; intellectual content, L.N, E.N, T.G.
Funding
This research was funded by the Research Council of Norway under the projects PRECISION (project no. 281140) and SMARTFOREST (project no. 309671).
Acknowledgements
We would like to thank the contractor, Valdres Skog AS, for permitting the use of their harvester data. We further thank Komatsu Forestry AB and Gundersen & Løken AS for their technical support, and the reviewers for their constructive comments.
Availability of research data
The data used in this study are owned by the contractor Valdres Skog AS and therefore not openly available. The statistical code used for this study is available upon request.
References
Arlinger J, Nordström M, Möller JJ (2012) StanForD (2010): modern communication with forest machines. Report from Skogforsk 785.
Berg S, Talbot B, Astrup R (2019) Silvismart, an EU‐wide Efficiency Portal for forest operations. Proceedings of the Nordic-Baltic Conference on Operational Research (NB-NORD).
Bhuiyan N, Möller J, Hannrup B, Arlinger J (2016) Automatisk gallringsuppföljning – Arealberäkning samt registrering av kranvinkel för identifiering av stickvägsträd och beräkning av gallringskvot. [Automatic thinning monitoring – Area calculation and registration of crane angle for identification of harvested trees and calculation of thinning quota]. Report from Skogforsk 899.
Brandtberg T (1999) Automatic individual tree based analysis of high spatial resolution aerial images on naturally regenerated boreal forests. Can J For Res 29: 1464–1478. https://doi.org/10.1139/x99-150.
Coops NC, Tompalski P, Goodbody TR, Queinnec M, Luther JE, Bolton DK, White JC, Wulder MA, van Lier OR, Hermosilla T (2021) Modelling lidar-derived estimates of forest attributes over space and time: a review of approaches and future trends. Remote Sens Environ 260, article id 112477. https://doi.org/10.1016/j.rse.2021.112477.
Dalponte M (2016) R package ‘itcSegment’: user manual. https://cran.r-project.org/web/packages/itcSegment/index.html.
Efron B (1978) Regression and ANOVA with zero-one data: measures of residual variation. J Am Stat Assoc 73: 113–121. https://doi.org/10.1080/01621459.1978.10480013.
Gobakken T, Næsset E (2008) Assessing effects of laser point density, ground sampling intensity, and field sample plot size on biophysical stand properties derived from airborne laser scanner data. Can J For Res 38: 1095–1109. https://doi.org/10.1139/X07-219.
Gobakken T, Næsset E (2009) Assessing effects of positioning errors and sample plot size on biophysical stand properties derived from airborne laser scanner data. Can J For Res 39:1036–1052. https://doi.org/10.1139/X09-025.
Hauglin M, Hansen EH, Næsset E, Busterud BE, Gjevestad JGO, Gobakken T. (2017). Accurate single-tree positions from a harvester: a test of two global satellite-based positioning systems. Scand J For Res 32: 774–781. https://doi.org/10.1080/02827581.2017.1296967.
Hauglin M, Hansen E, Sørngård E, Næsset E, Gobakken T (2018) Utilizing accurately positioned harvester data: modelling forest volume with airborne laser scanning. Can J For Res 48: 913–922. https://doi.org/10.1139/cjfr-2017-0467.
Hyyppä J (1999) Detecting and estimating attributes for single trees using laser scanner. Photogramm J Finland 16: 27–42.
Kangas A, Maltamo M (2006) Forest inventory: methodology and applications. Managing Forest Ecosystems 10. Springer Science & Business Media. https://doi.org/10.1007/1-4020-4381-3.
Kemmerer J, Labelle ER (2020) Using harvester data from on-board computers: a review of key findings, opportunities and challenges. Eur J For Res 140: 1–17. https://doi.org/10.1007/s10342-020-01313-4.
Kotivuori E, Korhonen L, Packalen P (2016) Nationwide airborne laser scanning based models for volume, biomass and dominant height in Finland. Silva Fenn 50, article id 1567. https://doi.org/10.14214/sf.1567.
La Hera P, Morales DO (2019) What do we observe when we equip a forestry crane with motion sensors? Croat J For Eng 40: 259–280. https://doi.org/10.5552/crojfe.2019.501.
Lindroos O, Ringdahl O, La Hera P, Hohnloser P, Hellström TH. (2015). Estimating the position of the harvester head – a key step towards the precision forestry of the future? Croat J For Eng 36: 147–164.
Lumley T (2004) The leaps package for regression subset selection. R package version 2.9.
Maltamo M, Hauglin M, Næsset E, Gobakken T (2019) Estimating stand level stem diameter distribution utilizing harvester data and airborne laser scanning. Silva Fenn 53, article id 10075. https://doi.org/10.14214/sf.10075.
Mauya EW, Hansen EH, Gobakken T, Bollandsås OM, Malimbwi RE, Næsset E (2015) Effects of field plot size on prediction accuracy of aboveground biomass in airborne laser scanning-assisted inventories in tropical rain forests of Tanzania. Carbon Balance Manag 10, article id 10. https://doi.org/10.1186/s13021-015-0021-x.
McRoberts RE, Chen Q, Gormanson DD, Walters BF (2018) The shelf-life of airborne laser scanning data for enhancing forest inventory inferences. Remote Sens Environ 206: 254–259. https://doi.org/10.1016/j.rse.2017.12.017.
Mooney CZ (1997) Monte carlo simulation. Sage Publications. https://doi.org/10.4135/9781412985116.
Müller F, Jaeger D, Hanewinkel M (2019) Digitization in wood supply – a review on how Industry 4.0 will change the forest value chain. Comput Electron Agric 162: 206–218. https://doi.org/10.1016/j.compag.2019.04.002.
Murphy G, Wilson I, Barr B (2006) Developing methods for pre-harvest inventories which use a harvester as the sampling tool. Aust For 69: 9–15. https://doi.org/10.1080/00049158.2006.10674982.
Næsset E (2002) Predicting forest stand characteristics with airborne scanning laser using a practical two-stage procedure and field data. Remote Sens Environ 80: 88–99. https://doi.org/10.1016/S0034-4257(01)00290-5.
Næsset E, Bollandsås OM, Gobakken T (2005) Comparing regression methods in estimation of biophysical properties of forest stands from two different inventories using laser scanner data. Remote Sens Environ 94: 541–553. https://doi.org/10.1016/j.rse.2004.11.010.
Næsset E, Bollandsås OM, Gobakken T, Solberg S, McRoberts RE (2015) The effects of field plot size on model-assisted estimation of aboveground biomass change using multitemporal interferometric SAR and airborne laser scanning data. Remote Sens Environ 168: 252–264. https://doi.org/10.1016/j.rse.2015.07.002.
Noordermeer L, Bollandsås OM, Ørka HO, Næsset E, Gobakken T (2019) Comparing the accuracies of forest attributes predicted from airborne laser scanning and digital aerial photogrammetry in operational forest inventories. Remote Sens Environ 226: 26–37. https://doi.org/10.1016/j.rse.2019.03.027.
Noordermeer L, Sørngård E, Astrup R, Næsset E, Gobakken T (2021) Coupling a differential global navigation satellite system to a cut-to-length harvester operating system enables precise positioning of harvested trees. Int J For Eng 32: 119–127. https://doi.org/10.1080/14942119.2021.1899686.
Olivera A (2016) Exploring opportunities for the integration of GNSS with forest harvester data to improve forest management. Doctoral thesis. University of Canterbury, Christchurch, New Zealand.
Packalen P, Strunk JL, Pitkänen JA, Temesgen H, Maltamo M (2015) Edge-tree correction for predicting forest inventory attributes using area-based approach with airborne laser scanning. IEEE J Sel Top Appl 8: 1274–1280. https://doi.org/10.1109/JSTARS.2015.2402693.
Rasinmäki J, Melkas T (2005) A method for estimating tree composition and volume using harvester data. Scand J For Res 20: 85–95. https://doi.org/10.1080/02827580510008185.
Saukkola A, Melkas T, Riekki K, Sirparanta S, Peuhkurinen J, Holopainen M, Hyyppä J, Vastaranta M (2019) Predicting forest inventory attributes using airborne laser scanning, aerial imagery, and harvester data. Remote Sens. 11, article id 797. https://doi.org/10.3390/rs11070797.
Söderberg J, Wallerman J, Almäng A, Möller JJ, Willén E (2021) Operational prediction of forest attributes using standardised harvester data and airborne laser scanning data in Sweden. Scand J For Res 36: 306–314. https://doi.org/10.1080/02827581.2021.1919751.
Westerberg S (2014) Semi-automating forestry machines: motion planning, system integration, and human-machine interaction. Doctoral thesis. Umeå Universitet, Sweden.
White JC, Coops NC, Wulder MA, Vastaranta M, Hilker T, Tompalski P (2016) Remote sensing technologies for enhancing forest inventories: a review. Can J Remote Sens 42: 619–641. https://doi.org/10.1080/07038992.2016.1207484.
Total of 36 references.
